

Prudential Premier Retirement Variable Annuities
Prudential Premier Retirement Variable Annuities
Prudential Premier Retirement Variable Annuities

Create successful ePaper yourself
Turn your PDF publications into a flip-book with our unique Google optimized e-Paper software.
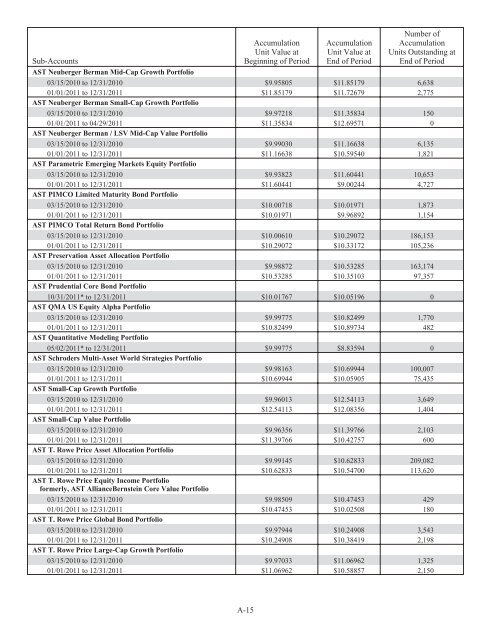
Sub-Accounts<br />
Accumulation<br />
Unit Value at<br />
Beginning of Period<br />
Accumulation<br />
Unit Value at<br />
End of Period<br />
Number of<br />
Accumulation<br />
Units Outstanding at<br />
End of Period<br />
AST Neuberger Berman Mid-Cap Growth Portfolio<br />
03/15/2010 to 12/31/2010 $9.95805 $11.85179 6,638<br />
01/01/2011 to 12/31/2011 $11.85179 $11.72679 2,775<br />
AST Neuberger Berman Small-Cap Growth Portfolio<br />
03/15/2010 to 12/31/2010 $9.97218 $11.35834 150<br />
01/01/2011 to 04/29/2011 $11.35834 $12.69571 0<br />
AST Neuberger Berman / LSV Mid-Cap Value Portfolio<br />
03/15/2010 to 12/31/2010 $9.99030 $11.16638 6,135<br />
01/01/2011 to 12/31/2011 $11.16638 $10.59540 1,821<br />
AST Parametric Emerging Markets Equity Portfolio<br />
03/15/2010 to 12/31/2010 $9.93823 $11.60441 10,653<br />
01/01/2011 to 12/31/2011 $11.60441 $9.00244 4,727<br />
AST PIMCO Limited Maturity Bond Portfolio<br />
03/15/2010 to 12/31/2010 $10.00718 $10.01971 1,873<br />
01/01/2011 to 12/31/2011 $10.01971 $9.96892 1,154<br />
AST PIMCO Total Return Bond Portfolio<br />
03/15/2010 to 12/31/2010 $10.00610 $10.29072 186,153<br />
01/01/2011 to 12/31/2011 $10.29072 $10.33172 105,236<br />
AST Preservation Asset Allocation Portfolio<br />
03/15/2010 to 12/31/2010 $9.98872 $10.53285 163,174<br />
01/01/2011 to 12/31/2011 $10.53285 $10.35103 97,357<br />
AST <strong>Prudential</strong> Core Bond Portfolio<br />
10/31/2011* to 12/31/2011 $10.01767 $10.05196 0<br />
AST QMA US Equity Alpha Portfolio<br />
03/15/2010 to 12/31/2010 $9.99775 $10.82499 1,770<br />
01/01/2011 to 12/31/2011 $10.82499 $10.89734 482<br />
AST Quantitative Modeling Portfolio<br />
05/02/2011* to 12/31/2011 $9.99775 $8.83594 0<br />
AST Schroders Multi-Asset World Strategies Portfolio<br />
03/15/2010 to 12/31/2010 $9.98163 $10.69944 100,007<br />
01/01/2011 to 12/31/2011 $10.69944 $10.05905 75,435<br />
AST Small-Cap Growth Portfolio<br />
03/15/2010 to 12/31/2010 $9.96013 $12.54113 3,649<br />
01/01/2011 to 12/31/2011 $12.54113 $12.08356 1,404<br />
AST Small-Cap Value Portfolio<br />
03/15/2010 to 12/31/2010 $9.96356 $11.39766 2,103<br />
01/01/2011 to 12/31/2011 $11.39766 $10.42757 600<br />
AST T. Rowe Price Asset Allocation Portfolio<br />
03/15/2010 to 12/31/2010 $9.99145 $10.62833 209,082<br />
01/01/2011 to 12/31/2011 $10.62833 $10.54700 113,620<br />
AST T. Rowe Price Equity Income Portfolio<br />
formerly, AST AllianceBernstein Core Value Portfolio<br />
03/15/2010 to 12/31/2010 $9.98509 $10.47453 429<br />
01/01/2011 to 12/31/2011 $10.47453 $10.02508 180<br />
AST T. Rowe Price Global Bond Portfolio<br />
03/15/2010 to 12/31/2010 $9.97944 $10.24908 3,543<br />
01/01/2011 to 12/31/2011 $10.24908 $10.38419 2,198<br />
AST T. Rowe Price Large-Cap Growth Portfolio<br />
03/15/2010 to 12/31/2010 $9.97033 $11.06962 1,325<br />
01/01/2011 to 12/31/2011 $11.06962 $10.58857 2,150<br />
A-15


