

Pre-Phase A Report - Lisa - Nasa
Pre-Phase A Report - Lisa - Nasa
Pre-Phase A Report - Lisa - Nasa

You also want an ePaper? Increase the reach of your titles
YUMPU automatically turns print PDFs into web optimized ePapers that Google loves.
4.2 Noises and error sources 87<br />
code employs Monte Carlo particle ray-tracing techniques to follow all particles (incident<br />
and generated) through three-dimensional representations of the LISA spacecraft geometry,<br />
taking into account all significant interactions. Table 4.3 shows the interactions that<br />
are currently modelled by GEANT. A more detailed discussion of the use of GEANT for<br />
this type of application can be found in [99].<br />
The geometric model constructed for LISA is summarised as follows: the 4 cm gold cubical<br />
test body is surrounded on all faces by 25 µm gold electrodes mounted on a cubicallysymmetric<br />
15 mm shell of quartz, enclosed in a 5 mm thick titanium vacuum housing,<br />
surrounded by 1 cm of carbon-epoxy representing the spacecraft structure. On two opposing<br />
faces of the cube, quartz windows (7 mm diameter) have been inserted in the<br />
titanium, quartz, and electrode layers, representing the access windows for LISA’s laser<br />
beams. Although this is a somewhat simplified representation, it does contain the key elements<br />
for accurate modelling, namely, a three-dimensional description of the intervening<br />
layers of material between the proof mass and the exposed spacecraft outer surface.<br />
Figure 4.5 shows the computed net charging of the LISA proof mass as a function of<br />
incident particle energy. To produce this curve, GEANT was used to analyse the effect of<br />
isotropic particles striking the outer spacecraft walls, for a range of energies from 100 MeV<br />
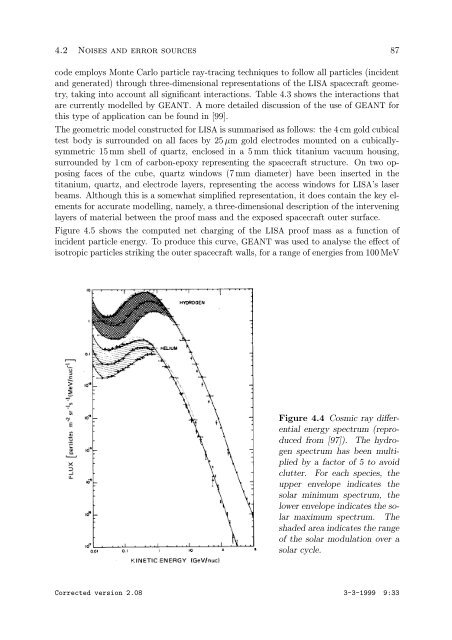
Figure 4.4 Cosmic ray differential<br />
energy spectrum (reproduced<br />
from [97]). The hydrogen<br />
spectrum has been multiplied<br />
by a factor of 5 to avoid<br />
clutter. For each species, the<br />
upper envelope indicates the<br />
solar minimum spectrum, the<br />
lower envelope indicates the solar<br />
maximum spectrum. The<br />
shaded area indicates the range<br />
of the solar modulation over a<br />
solar cycle.<br />
Corrected version 2.08 3-3-1999 9:33