

Pre-Phase A Report - Lisa - Nasa
Pre-Phase A Report - Lisa - Nasa
Pre-Phase A Report - Lisa - Nasa

You also want an ePaper? Increase the reach of your titles
YUMPU automatically turns print PDFs into web optimized ePapers that Google loves.
1.2 Low-frequency sources of gravitational radiation 31<br />
for this frequency range. This is done in order for give some basis for considering the<br />
S/N ratio for the case of 10 6 M⊙ MBH masses.<br />
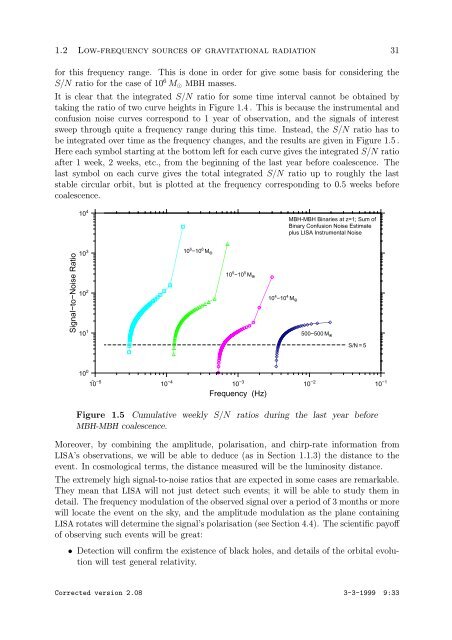
It is clear that the integrated S/N ratio for some time interval cannot be obtained by<br />
taking the ratio of two curve heights in Figure 1.4 . This is because the instrumental and<br />
confusion noise curves correspond to 1 year of observation, and the signals of interest<br />
sweep through quite a frequency range during this time. Instead, the S/N ratio has to<br />
be integrated over time as the frequency changes, and the results are given in Figure 1.5 .<br />
Here each symbol starting at the bottom left for each curve gives the integrated S/N ratio<br />
after 1 week, 2 weeks, etc., from the beginning of the last year before coalescence. The<br />
last symbol on each curve gives the total integrated S/N ratio up to roughly the last<br />
stable circular orbit, but is plotted at the frequency corresponding to 0.5 weeks before<br />
coalescence.<br />
Signal−to−Noise Ratio<br />
104.0 4<br />
103.0 3<br />
Log (S/N Ratio)<br />
102.0 2<br />
101.0 1<br />
10 6 /10 6 M ⁄<br />
10 6 −10 6 M •O<br />
10 5 /10 5 M ⁄<br />
10 5 −10 5 M •O<br />
10 4 /10 4 M ⁄<br />
MBH-MBH Binaries at z=1; Sum of<br />
Binary Confusion Noise Estimate<br />
plus LISA Instrumental Noise<br />
500/500 500−500 M M ⁄ •O<br />
S/N=5<br />
0.0<br />
-5.0<br />
10<br />
-4.5 -4.0 -3.5 -3.0<br />
Log Frequency (Hz)<br />
-2.5 -2.0 -1.5 -1.0<br />
−5<br />
10 −4<br />
10 −3<br />
10 −2<br />
10 −1<br />
10 0<br />
Frequency (Hz)<br />
10 4 −10 4 M •O<br />
Figure 1.5 Cumulative weekly S/N ratios during the last year before<br />
MBH-MBH coalescence.<br />
Moreover, by combining the amplitude, polarisation, and chirp-rate information from<br />
LISA’s observations, we will be able to deduce (as in Section 1.1.3) the distance to the<br />
event. In cosmological terms, the distance measured will be the luminosity distance.<br />
The extremely high signal-to-noise ratios that are expected in some cases are remarkable.<br />
They mean that LISA will not just detect such events; it will be able to study them in<br />
detail. The frequency modulation of the observed signal over a period of 3 months or more<br />
will locate the event on the sky, and the amplitude modulation as the plane containing<br />
LISA rotates will determine the signal’s polarisation (see Section 4.4). The scientific payoff<br />
of observing such events will be great:<br />
• Detection will confirm the existence of black holes, and details of the orbital evolution<br />
will test general relativity.<br />
Corrected version 2.08 3-3-1999 9:33