

Pre-Phase A Report - Lisa - Nasa
Pre-Phase A Report - Lisa - Nasa
Pre-Phase A Report - Lisa - Nasa

You also want an ePaper? Increase the reach of your titles
YUMPU automatically turns print PDFs into web optimized ePapers that Google loves.
4.2 Noises and error sources 89<br />
charge rate (normalised)<br />
0.8<br />
0.7<br />
0.6<br />
0.5<br />
0.4<br />
0.3<br />
0.2<br />
0.1<br />
0<br />
H+<br />
He++<br />
−0.1<br />
0 500 1000 1500 2000<br />
incident energy (MeV)<br />
charge rate (normalised)<br />
0.8<br />
0.7<br />
0.6<br />
0.5<br />
0.4<br />
0.3<br />
0.2<br />
0.1<br />
0<br />
−0.1<br />
2000 4000 6000 8000 10000<br />
incident energy (MeV)<br />
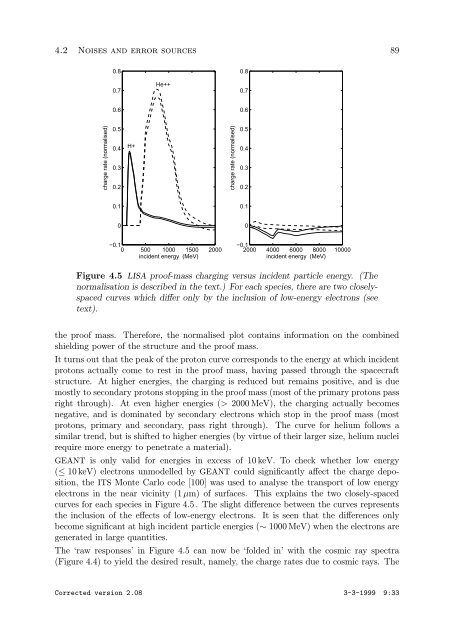
Figure 4.5 LISA proof-mass charging versus incident particle energy. (The<br />
normalisation is described in the text.) For each species, there are two closelyspaced<br />
curves which differ only by the inclusion of low-energy electrons (see<br />
text).<br />
the proof mass. Therefore, the normalised plot contains information on the combined<br />
shielding power of the structure and the proof mass.<br />
It turns out that the peak of the proton curve corresponds to the energy at which incident<br />
protons actually come to rest in the proof mass, having passed through the spacecraft<br />
structure. At higher energies, the charging is reduced but remains positive, and is due<br />
mostly to secondary protons stopping in the proof mass (most of the primary protons pass<br />
right through). At even higher energies (> 2000 MeV), the charging actually becomes<br />
negative, and is dominated by secondary electrons which stop in the proof mass (most<br />
protons, primary and secondary, pass right through). The curve for helium follows a<br />
similar trend, but is shifted to higher energies (by virtue of their larger size, helium nuclei<br />
require more energy to penetrate a material).<br />
GEANT is only valid for energies in excess of 10 keV. To check whether low energy<br />
(≤ 10 keV) electrons unmodelled by GEANT could significantly affect the charge deposition,<br />
the ITS Monte Carlo code [100] was used to analyse the transport of low energy<br />
electrons in the near vicinity (1 µm) of surfaces. This explains the two closely-spaced<br />
curves for each species in Figure 4.5 . The slight difference between the curves represents<br />
the inclusion of the effects of low-energy electrons. It is seen that the differences only<br />
become significant at high incident particle energies (∼ 1000 MeV) when the electrons are<br />
generated in large quantities.<br />
The ‘raw responses’ in Figure 4.5 can now be ‘folded in’ with the cosmic ray spectra<br />
(Figure 4.4) to yield the desired result, namely, the charge rates due to cosmic rays. The<br />
Corrected version 2.08 3-3-1999 9:33