

Pre-Phase A Report - Lisa - Nasa
Pre-Phase A Report - Lisa - Nasa
Pre-Phase A Report - Lisa - Nasa

You also want an ePaper? Increase the reach of your titles
YUMPU automatically turns print PDFs into web optimized ePapers that Google loves.
30 Chapter 1 Scientific Objectives<br />
If sudden collapses to MBHs do occur for gas clouds large enough to give roughly 10 5 to<br />
10 7 M⊙ MBHs, an important question is how much angular momentum will be left. If the<br />
cloud hasn’t lost its angular momentum rapidly enough, a bar instability may occur and<br />
cause considerable gravitational radiation in the main LISA frequency band. Thus looking<br />
for pulses lasting only a few cycles will be important for LISA, as it is for supernova pulse<br />
searches with ground-based detectors.<br />
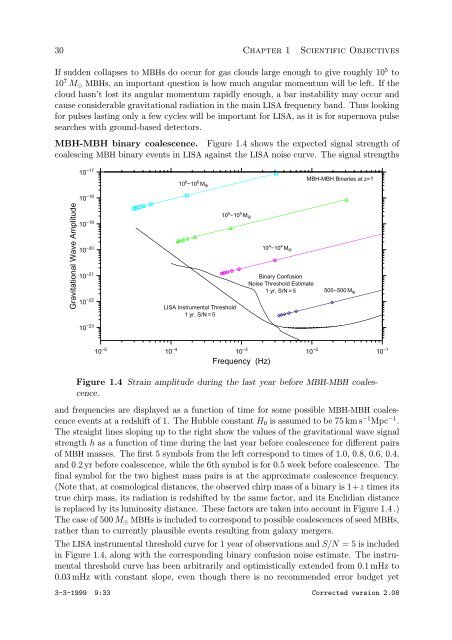
MBH-MBH binary coalescence. Figure 1.4 shows the expected signal strength of<br />
coalescing MBH binary events in LISA against the LISA noise curve. The signal strengths<br />
Gravitational Wave Amplitude<br />
10 −17<br />
Log h<br />
-17.5<br />
10 −18<br />
-18.5<br />
10 −19<br />
-19.5<br />
10 −20<br />
-20.5<br />
10 −21<br />
-21.5<br />
10 −22<br />
-22.5<br />
10 −23<br />
-23.5<br />
10 6 −10 6 M •O<br />
10 6 /10 6 M ⁄<br />
10 5 −10 5 M •O<br />
LISA Instrumental Threshold<br />
LISA Instrumental 1 yr, S/N=5 Threshold<br />
1 yr, S/N = 5<br />
10 5 /10 5 M ⁄<br />
10 4 /10 4 M ⁄<br />
Binary Confusion<br />
Binary Confusion<br />
Noise Threshold Estimate; Estimate<br />
1 yr, yr, S/N=5 S/N = 5<br />
MBH-MBH Binaries at z=1<br />
500−500 500/500 M M⁄ •O<br />
-5.0 -4.5 -4.0 -3.5 -3.0 -2.5 -2.0 -1.5 -1.0<br />
10<br />
Log Frequency (Hz)<br />
−5<br />
10 −4<br />
10 −3<br />
10 −2<br />
10 −1<br />
Frequency (Hz)<br />
10 4 −10 4 M •O<br />
Figure 1.4 Strain amplitude during the last year before MBH-MBH coalescence.<br />
and frequencies are displayed as a function of time for some possible MBH-MBH coalescence<br />
events at a redshift of 1. The Hubble constant H0 is assumed to be 75 km s−1Mpc−1 .<br />
The straight lines sloping up to the right show the values of the gravitational wave signal<br />
strength h as a function of time during the last year before coalescence for different pairs<br />
of MBH masses. The first 5 symbols from the left correspond to times of 1.0, 0.8, 0.6, 0.4,<br />
and 0.2 yr before coalescence, while the 6th symbol is for 0.5 week before coalescence. The<br />
final symbol for the two highest mass pairs is at the approximate coalescence frequency.<br />
(Note that, at cosmological distances, the observed chirp mass of a binary is 1+z times its<br />
true chirp mass, its radiation is redshifted by the same factor, and its Euclidian distance<br />
is replaced by its luminosity distance. These factors are taken into account in Figure 1.4 .)<br />
The case of 500 M⊙ MBHs is included to correspond to possible coalescences of seed MBHs,<br />
rather than to currently plausible events resulting from galaxy mergers.<br />
The LISA instrumental threshold curve for 1 year of observations and S/N = 5 is included<br />
in Figure 1.4, along with the corresponding binary confusion noise estimate. The instrumental<br />
threshold curve has been arbitrarily and optimistically extended from 0.1 mHz to<br />
0.03 mHz with constant slope, even though there is no recommended error budget yet<br />
3-3-1999 9:33 Corrected version 2.08