- Page 1 and 2:
TOXICOLOGICAL PROFILE FOR MALATHION
- Page 3:
MALATHION iii UPDATE STATEMENT A To
- Page 8 and 9:
MALATHION viii Managing Hazardous M
- Page 11:
MALATHION xi PEER REVIEW A peer rev
- Page 14 and 15:
MALATHION xiv 3.2.3.2 Systemic Effe
- Page 17:
MALATHION xvii LIST OF FIGURES 3-1.
- Page 20 and 21:
MALATHION 1 1. PUBLIC HEALTH STATEM
- Page 22 and 23:
MALATHION 3 1. PUBLIC HEALTH STATEM
- Page 24 and 25:
MALATHION 5 1. PUBLIC HEALTH STATEM
- Page 26 and 27:
MALATHION 7 1. PUBLIC HEALTH STATEM
- Page 28 and 29:
MALATHION 9 1. PUBLIC HEALTH STATEM
- Page 30:
MALATHION 11 1. PUBLIC HEALTH STATE
- Page 33 and 34:
MALATHION 14 2. RELEVANCE TO PUBLIC
- Page 35 and 36:
MALATHION 16 2. RELEVANCE TO PUBLIC
- Page 37 and 38:
MALATHION 18 2. RELEVANCE TO PUBLIC
- Page 39 and 40:
MALATHION 20 2. RELEVANCE TO PUBLIC
- Page 41 and 42:
MALATHION 22 2. RELEVANCE TO PUBLIC
- Page 43 and 44:
MALATHION 24 3. HEALTH EFFECTS oral
- Page 45 and 46:
MALATHION 26 3. HEALTH EFFECTS sing
- Page 47 and 48:
≤
- Page 49 and 50:
MALATHION 30 3. HEALTH EFFECTS Resp
- Page 51 and 52:
MALATHION 32 3. HEALTH EFFECTS Rena
- Page 53 and 54:
MALATHION 34 3. HEALTH EFFECTS Stud
- Page 55 and 56:
MALATHION 36 3. HEALTH EFFECTS Fran
- Page 57 and 58:
MALATHION 38 3. HEALTH EFFECTS more
- Page 59 and 60:
MALATHION 40 3. HEALTH EFFECTS the
- Page 61 and 62:
a Key to figure 1 2 3 4 5 6 Species
- Page 63 and 64:
a Key to figure 15 16 17 18 Species
- Page 65 and 66:
a Key to figure 24 25 26 27 28 29 S
- Page 67 and 68:
a Key to figure 40 41 42 43 44 45 S
- Page 69 and 70:
a Key to figure 55 56 57 58 59 60 S
- Page 71 and 72:
a Key to figure 67 68 69 70 Species
- Page 73 and 74:
a Key to figure 83 84 85 86 87 88 8
- Page 75 and 76:
a Key to figure 91 Species (Strain)
- Page 77 and 78:
a Key to figure 93 94 Species (Stra
- Page 79 and 80:
≤
- Page 81 and 82:
≤
- Page 83 and 84:
MALATHION 64 3.2.2.2 Systemic Effec
- Page 85 and 86:
MALATHION 66 3. HEALTH EFFECTS 1965
- Page 87 and 88:
MALATHION 68 3. HEALTH EFFECTS Hepa
- Page 89 and 90:
MALATHION 70 3. HEALTH EFFECTS appr
- Page 91 and 92:
MALATHION 72 3. HEALTH EFFECTS an u
- Page 93 and 94:
MALATHION 74 3. HEALTH EFFECTS Meta
- Page 95 and 96:
MALATHION 76 3. HEALTH EFFECTS clas
- Page 97 and 98:
MALATHION 78 3. HEALTH EFFECTS was
- Page 99 and 100:
MALATHION 80 3. HEALTH EFFECTS appr
- Page 101 and 102:
MALATHION 82 3. HEALTH EFFECTS Clin
- Page 103 and 104:
MALATHION 84 3. HEALTH EFFECTS mala
- Page 105 and 106:
MALATHION 86 3. HEALTH EFFECTS Tera
- Page 107 and 108:
MALATHION 88 3. HEALTH EFFECTS for
- Page 109 and 110:
MALATHION 90 3. HEALTH EFFECTS sugg
- Page 111 and 112:
Species (Strain) Systemic Exposure/
- Page 113 and 114:
MALATHION 94 3. HEALTH EFFECTS Endo
- Page 115 and 116:
MALATHION 96 3. HEALTH EFFECTS Othe
- Page 117 and 118:
MALATHION 98 3. HEALTH EFFECTS derm
- Page 119 and 120:
MALATHION 100 3. HEALTH EFFECTS al.
- Page 121 and 122:
MALATHION 102 3. HEALTH EFFECTS of
- Page 123 and 124:
MALATHION 104 3. HEALTH EFFECTS per
- Page 125 and 126:
MALATHION 106 3.4.1.1 Inhalation Ex
- Page 127 and 128:
MALATHION 108 3. HEALTH EFFECTS was
- Page 129 and 130:
MALATHION 110 3. HEALTH EFFECTS fir
- Page 131 and 132:
MALATHION 112 3.4.2.3 Dermal Exposu
- Page 133 and 134:
MALATHION 114 3. HEALTH EFFECTS neu
- Page 135 and 136:
MALATHION 116 3. HEALTH EFFECTS aci
- Page 137 and 138:
MALATHION 118 3.4.4.1 Inhalation Ex
- Page 139 and 140:
MALATHION 120 3. HEALTH EFFECTS agr
- Page 141 and 142:
MALATHION 122 V E N O U S BLOOD 3.
- Page 143 and 144:
MALATHION 124 3. HEALTH EFFECTS Tab
- Page 145 and 146:
MALATHION 126 3. HEALTH EFFECTS mus
- Page 147 and 148:
MALATHION 128 3.5.2 Mechanisms of T
- Page 149 and 150:
MALATHION 130 3. HEALTH EFFECTS pla
- Page 151 and 152:
MALATHION 132 3. HEALTH EFFECTS In
- Page 153 and 154:
MALATHION 134 3. HEALTH EFFECTS Ove
- Page 155 and 156:
MALATHION 136 3. HEALTH EFFECTS are
- Page 157 and 158:
MALATHION 138 3. HEALTH EFFECTS whe
- Page 159 and 160:
MALATHION 140 3. HEALTH EFFECTS the
- Page 161 and 162:
MALATHION 142 3. HEALTH EFFECTS org
- Page 163 and 164:
MALATHION 144 3. HEALTH EFFECTS The
- Page 165 and 166:
MALATHION 146 3. HEALTH EFFECTS pla
- Page 167 and 168:
MALATHION 148 3. HEALTH EFFECTS org
- Page 169 and 170:
MALATHION 150 3. HEALTH EFFECTS stu
- Page 171 and 172:
MALATHION 152 3. HEALTH EFFECTS Par
- Page 173 and 174:
MALATHION 154 3. HEALTH EFFECTS exp
- Page 175 and 176:
MALATHION 156 3. HEALTH EFFECTS wer
- Page 177 and 178:
MALATHION 158 3. HEALTH EFFECTS who
- Page 179 and 180:
MALATHION 160 3. HEALTH EFFECTS Lee
- Page 181 and 182:
MALATHION 162 3. HEALTH EFFECTS res
- Page 183 and 184:
MALATHION 164 3. HEALTH EFFECTS inf
- Page 185 and 186:
MALATHION 166 3. HEALTH EFFECTS med
- Page 187 and 188:
MALATHION 168 4. CHEMICAL AND PHYSI
- Page 190 and 191:
MALATHION 171 5. PRODUCTION, IMPORT
- Page 192 and 193:
MALATHION 173 5. PRODUCTION, IMPORT
- Page 194 and 195:
MALATHION 175 6.1 OVERVIEW 6. POTEN
- Page 196 and 197:
MALATHION 177 6. POTENTIAL FOR HUMA
- Page 198 and 199:
MALATHION 179 6. POTENTIAL FOR HUMA
- Page 200 and 201:
MALATHION 181 6. POTENTIAL FOR HUMA
- Page 202 and 203:
MALATHION 183 6. POTENTIAL FOR HUMA
- Page 204 and 205:
MALATHION 185 6. POTENTIAL FOR HUMA
- Page 206 and 207:
MALATHION 187 6.3.2.1 Air 6. POTENT
- Page 208 and 209:
MALATHION 189 6. POTENTIAL FOR HUMA
- Page 210 and 211:
MALATHION 191 6. POTENTIAL FOR HUMA
- Page 212 and 213:
MALATHION 193 6. POTENTIAL FOR HUMA
- Page 214 and 215:
MALATHION 195 6. POTENTIAL FOR HUMA
- Page 216 and 217:
MALATHION 197 6. POTENTIAL FOR HUMA
- Page 218 and 219:
MALATHION 199 6. POTENTIAL FOR HUMA
- Page 220 and 221:
MALATHION 201 6. POTENTIAL FOR HUMA
- Page 222 and 223:
MALATHION 203 6. POTENTIAL FOR HUMA
- Page 224 and 225:
MALATHION 205 6. POTENTIAL FOR HUMA
- Page 226 and 227:
MALATHION 207 6. POTENTIAL FOR HUMA
- Page 228 and 229:
MALATHION 209 6. POTENTIAL FOR HUMA
- Page 230 and 231:
MALATHION 211 6. POTENTIAL FOR HUMA
- Page 232:
MALATHION 213 6. POTENTIAL FOR HUMA
- Page 235 and 236:
MALATHION 216 7. ANALYTICAL METHODS
- Page 237 and 238:
MALATHION 218 7. ANALYTICAL METHODS
- Page 239 and 240:
MALATHION 220 7. ANALYTICAL METHODS
- Page 241 and 242:
MALATHION 222 7. ANALYTICAL METHODS
- Page 243 and 244:
MALATHION 224 7.3.1 Identification
- Page 245 and 246:
MALATHION 226 8. REGULATIONS AND AD
- Page 247 and 248:
MALATHION 228 8. REGULATIONS AND AD
- Page 249 and 250:
MALATHION 230 8. REGULATIONS AND AD
- Page 251 and 252:
MALATHION 232 8. REGULATIONS AND AD
- Page 253 and 254:
MALATHION 234 8. REGULATIONS AND AD
- Page 255 and 256:
MALATHION 236 8. REGULATIONS AND AD
- Page 257 and 258:
MALATHION 238 9. REFERENCES *Agency
- Page 259 and 260:
MALATHION 240 9. REFERENCES *Barnes
- Page 261 and 262:
MALATHION 242 9. REFERENCES *Brown
- Page 263 and 264:
MALATHION 244 9. REFERENCES *Choi P
- Page 265 and 266: MALATHION 246 9. REFERENCES *De Ble
- Page 267 and 268: MALATHION 248 9. REFERENCES Ehrich
- Page 269 and 270: MALATHION 250 9. REFERENCES EPA. 20
- Page 271 and 272: MALATHION 252 9. REFERENCES *Gaines
- Page 273 and 274: MALATHION 254 9. REFERENCES *Harman
- Page 275 and 276: MALATHION 256 9. REFERENCES Jianmon
- Page 277 and 278: MALATHION 258 9. REFERENCES Kimbrou
- Page 279 and 280: MALATHION 260 9. REFERENCES *Lechne
- Page 281 and 282: MALATHION 262 9. REFERENCES *Mackis
- Page 283 and 284: MALATHION 264 9. REFERENCES Mohn G.
- Page 285 and 286: MALATHION 266 9. REFERENCES NIOSH.
- Page 287 and 288: MALATHION 268 9. REFERENCES *Prabha
- Page 289 and 290: MALATHION 270 9. REFERENCES *Roy RR
- Page 291 and 292: MALATHION 272 9. REFERENCES *Singar
- Page 293 and 294: MALATHION 274 9. REFERENCES *Thongs
- Page 295 and 296: MALATHION 276 9. REFERENCES Viccell
- Page 297 and 298: MALATHION 278 9. REFERENCES Yess NJ
- Page 299 and 300: MALATHION 280 10. GLOSSARY Ceiling
- Page 301 and 302: MALATHION 282 10. GLOSSARY Mutagen
- Page 303 and 304: MALATHION 284 10. GLOSSARY Risk—T
- Page 305 and 306: MALATHION A-2 APPENDIX A are not ex
- Page 307 and 308: MALATHION A-4 APPENDIX A Was a conv
- Page 309 and 310: MALATHION A-6 APPENDIX A Was a conv
- Page 311 and 312: MALATHION A-8 APPENDIX A If an inha
- Page 313 and 314: MALATHION A-10 Uncertainty Factors
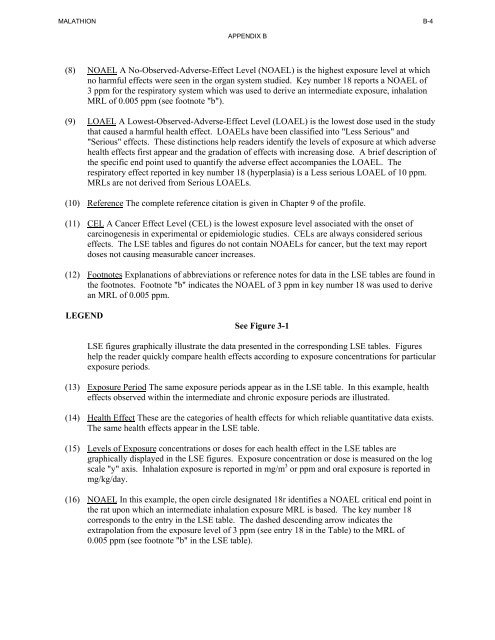
- Page 315: MALATHION B-2 Interpretation of Min
- Page 319 and 320: 1 2 3 4 12 → → → → → Key
- Page 322 and 323: MALATHION C-1 APPENDIX C. ACRONYMS,
- Page 324 and 325: MALATHION C-3 APPENDIX C MFO mixed
- Page 326: MALATHION C-5 > greater than $ grea