Equality, Participation, Transition: Essays in Honour of Branko Horvat
Equality, Participation, Transition: Essays in Honour of Branko Horvat
Equality, Participation, Transition: Essays in Honour of Branko Horvat

Create successful ePaper yourself
Turn your PDF publications into a flip-book with our unique Google optimized e-Paper software.
<strong>Branko</strong> Milanović 67<br />
substantially altered. The l<strong>in</strong>e labeled ‘G<strong>in</strong>i (<strong>in</strong>come alone)’ <strong>in</strong> Figure 4.4<br />
shows the calculated G<strong>in</strong>i coefficients that would obta<strong>in</strong> if <strong>in</strong>come<br />
alone determ<strong>in</strong>ed <strong>in</strong>equality. An upward and short bulge <strong>in</strong> <strong>in</strong>equality<br />
is followed by a prolonged and slow decrease <strong>in</strong> <strong>in</strong>equality as <strong>in</strong>come<br />
levels rise. The Figure also shows that, if <strong>in</strong>come alone mattered, the<br />
differences <strong>in</strong> <strong>in</strong>equality between rich and poor countries would be relatively<br />
small. While the standard deviation <strong>of</strong> the actual GINI <strong>in</strong> our<br />
sample is 11.7, the standard deviation <strong>of</strong> the thus calculated GINI is only<br />
3.4 (see Table 4.4). The distance between the ‘G<strong>in</strong>i (<strong>in</strong>come alone)’ l<strong>in</strong>e<br />
and the l<strong>in</strong>e obta<strong>in</strong>ed from our regression (6) is due, save for the statistical<br />
discrepancy, to the role <strong>of</strong> social choice variables. The distance<br />
widens around $5000 per capita. For all countries with higher <strong>in</strong>comes<br />
(except for Hong Kong; see po<strong>in</strong>t HK <strong>in</strong> Figure 4.4), the divergence, and<br />
hence the role <strong>of</strong> social factors, is substantial. One can therefore propose<br />
two turn<strong>in</strong>g po<strong>in</strong>ts <strong>of</strong> <strong>in</strong>equality: the first would occur at the level <strong>of</strong><br />
approximately $2100 where, as noted before, the standard Kuznets curve<br />
l<strong>in</strong>k<strong>in</strong>g <strong>in</strong>come and GINI beg<strong>in</strong>s to turn downward. The second occurs<br />
at around $5000 when social choice variables become significantly more<br />
important than before and re<strong>in</strong>force the downward trend <strong>in</strong> <strong>in</strong>equality.<br />
The difference between the unweighted G<strong>in</strong>i based on ‘<strong>in</strong>come alone’<br />
and the actual G<strong>in</strong>i <strong>in</strong> the whole sample amounts to 14.3 G<strong>in</strong>i po<strong>in</strong>ts<br />
(Table 4.4). This is, therefore, the jo<strong>in</strong>t effect <strong>of</strong> social transfers and<br />
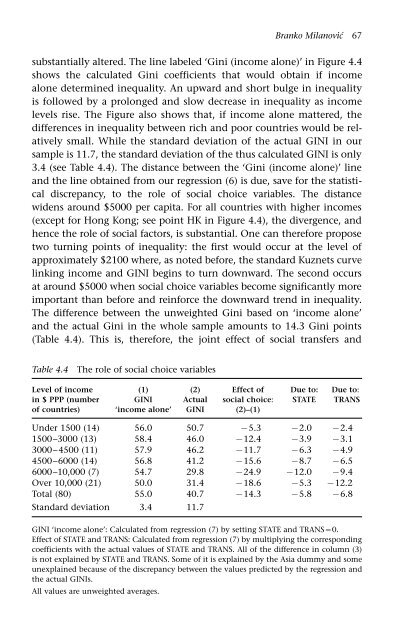
Table 4.4 The role <strong>of</strong> social choice variables<br />
Level <strong>of</strong> <strong>in</strong>come (1) (2) Effect <strong>of</strong> Due to: Due to:<br />
<strong>in</strong> $ PPP (number GINI Actual social choice: STATE TRANS<br />
<strong>of</strong> countries) ‘<strong>in</strong>come alone’ GINI (2)–(1)<br />
Under 1500 (14) 56.0 50.7 5.3 2.0 2.4<br />
1500–3000 (13) 58.4 46.0 12.4 3.9 3.1<br />
3000–4500 (11) 57.9 46.2 11.7 6.3 4.9<br />
4500–6000 (14) 56.8 41.2 15.6 8.7 6.5<br />
6000–10,000 (7) 54.7 29.8 24.9 12.0 9.4<br />
Over 10,000 (21) 50.0 31.4 18.6 5.3 12.2<br />
Total (80) 55.0 40.7 14.3 5.8 6.8<br />
Standard deviation 3.4 11.7<br />
GINI ‘<strong>in</strong>come alone’: Calculated from regression (7) by sett<strong>in</strong>g STATE and TRANS0.<br />
Effect <strong>of</strong> STATE and TRANS: Calculated from regression (7) by multiply<strong>in</strong>g the correspond<strong>in</strong>g<br />
coefficients with the actual values <strong>of</strong> STATE and TRANS. All <strong>of</strong> the difference <strong>in</strong> column (3)<br />
is not expla<strong>in</strong>ed by STATE and TRANS. Some <strong>of</strong> it is expla<strong>in</strong>ed by the Asia dummy and some<br />
unexpla<strong>in</strong>ed because <strong>of</strong> the discrepancy between the values predicted by the regression and<br />
the actual GINIs.<br />
All values are unweighted averages.