Equality, Participation, Transition: Essays in Honour of Branko Horvat
Equality, Participation, Transition: Essays in Honour of Branko Horvat
Equality, Participation, Transition: Essays in Honour of Branko Horvat

Create successful ePaper yourself
Turn your PDF publications into a flip-book with our unique Google optimized e-Paper software.
54 Determ<strong>in</strong>ants <strong>of</strong> Income Inequality<br />
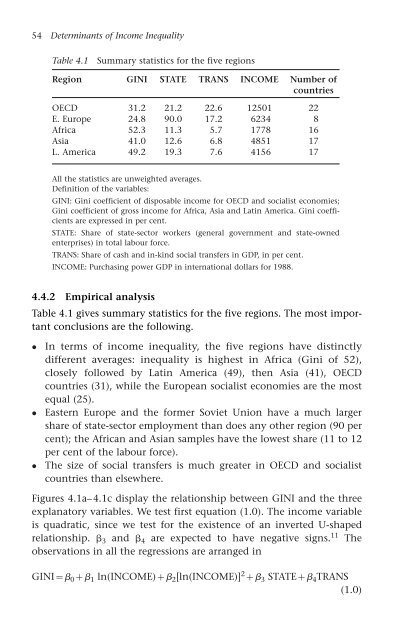
Table 4.1 Summary statistics for the five regions<br />
Region GINI STATE TRANS INCOME Number <strong>of</strong><br />
countries<br />
OECD 31.2 21.2 22.6 12501 22<br />
E. Europe 24.8 90.0 17.2 6234 8<br />
Africa 52.3 11.3 5.7 1778 16<br />
Asia 41.0 12.6 6.8 4851 17<br />
L. America 49.2 19.3 7.6 4156 17<br />
All the statistics are unweighted averages.<br />
Def<strong>in</strong>ition <strong>of</strong> the variables:<br />
GINI: G<strong>in</strong>i coefficient <strong>of</strong> disposable <strong>in</strong>come for OECD and socialist economies;<br />
G<strong>in</strong>i coefficient <strong>of</strong> gross <strong>in</strong>come for Africa, Asia and Lat<strong>in</strong> America. G<strong>in</strong>i coefficients<br />
are expressed <strong>in</strong> per cent.<br />
STATE: Share <strong>of</strong> state-sector workers (general government and state-owned<br />
enterprises) <strong>in</strong> total labour force.<br />
TRANS: Share <strong>of</strong> cash and <strong>in</strong>-k<strong>in</strong>d social transfers <strong>in</strong> GDP, <strong>in</strong> per cent.<br />
INCOME: Purchas<strong>in</strong>g power GDP <strong>in</strong> <strong>in</strong>ternational dollars for 1988.<br />
4.4.2 Empirical analysis<br />
Table 4.1 gives summary statistics for the five regions. The most important<br />
conclusions are the follow<strong>in</strong>g.<br />
In terms <strong>of</strong> <strong>in</strong>come <strong>in</strong>equality, the five regions have dist<strong>in</strong>ctly<br />
different averages: <strong>in</strong>equality is highest <strong>in</strong> Africa (G<strong>in</strong>i <strong>of</strong> 52),<br />
closely followed by Lat<strong>in</strong> America (49), then Asia (41), OECD<br />
countries (31), while the European socialist economies are the most<br />
equal (25).<br />
Eastern Europe and the former Soviet Union have a much larger<br />
share <strong>of</strong> state-sector employment than does any other region (90 per<br />
cent); the African and Asian samples have the lowest share (11 to 12<br />
per cent <strong>of</strong> the labour force).<br />
The size <strong>of</strong> social transfers is much greater <strong>in</strong> OECD and socialist<br />
countries than elsewhere.<br />
Figures 4.1a–4.1c display the relationship between GINI and the three<br />
explanatory variables. We test first equation (1.0). The <strong>in</strong>come variable<br />
is quadratic, s<strong>in</strong>ce we test for the existence <strong>of</strong> an <strong>in</strong>verted U-shaped<br />
relationship. 3 and 4 are expected to have negative signs. 11 The<br />
observations <strong>in</strong> all the regressions are arranged <strong>in</strong><br />
GINI 0 1 ln(INCOME) 2[ln(INCOME)] 2 3 STATE 4TRANS<br />
(1.0)