Registration Document 2005 - Total.com
Registration Document 2005 - Total.com
Registration Document 2005 - Total.com

You also want an ePaper? Increase the reach of your titles
YUMPU automatically turns print PDFs into web optimized ePapers that Google loves.
9<br />
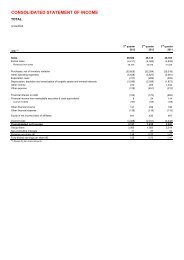
Appendix 1 – Consolidated financial statements<br />
Notes to the consolidated financial statements<br />
<strong>2005</strong> (adjusted) (in millions of euros) Upstream Downstream Chemicals Corporate Inter<strong>com</strong>pany <strong>Total</strong><br />
Non-Group sales 20,888 99,934 22,326 20 - 143,168<br />
Intersegment sales 19,139 4,293 1,153 170 (24,755) -<br />
Excise taxes - (20,550) - - - (20,550)<br />
Revenues from sales 40,027 83,677 23,479 190 (24,755) 122,618<br />
Operating expenses (18,275) (78,714) (21,408) (624) 24,755 (94,266)<br />
Depreciation, depletion and amortization<br />
of tangible assets and leasehold rights (3,331) (1,064) (722) (33) - (5,150)<br />
Adjusted operating in<strong>com</strong>e 18,421 3,899 1,349 (467) - 23,202<br />
Equity in in<strong>com</strong>e (loss) of affiliates<br />
and other items 587 346 33 912 - 1,878<br />
Tax on net operating in<strong>com</strong>e (10,979) (1,329) (425) 229 - (12,504)<br />
Adjusted net operating in<strong>com</strong>e 8,029 2,916 957 674 12,576<br />
Net cost of net debt (211)<br />
Minority interests and dividends on<br />
subsidiaries’ redeemable preferred shares (362)<br />
Adjusted net in<strong>com</strong>e 12,003<br />
<strong>2005</strong> (in millions of euros) Upstream Downstream Chemicals Corporate Inter<strong>com</strong>pany <strong>Total</strong><br />
<strong>Total</strong> expenditures 8,111 1,779 1,115 190 11,195<br />
Divestitures at sale price 692 204 59 133 1,088<br />
Cash flow from operating activities 10,111 2,723 946 889 14,669<br />
Balance Sheet as of December 31, <strong>2005</strong><br />
Property, plant and equipment,<br />
intangible assets 30,140 8,016 6,567 229 44,952<br />
Investments in equity affiliates 1,958 1,575 733 7,087 11,353<br />
Loans to equity affiliates and other<br />
non-current assets 2,673 1,386 848 702 5,609<br />
Working capital (432) 6,035 3,927 96 9,626<br />
Provisions and other non-current liabilities (10,817) (2,409) (2,827) (1,387) (17,440)<br />
Capital Employed (Balance Sheet) 23,522 14,603 9,248 6,727 54,100<br />
Less inventory valuation effect - (3,182) (261) 786 (2,657)<br />
Capital Employed (Business segment<br />
information) 23,522 11,421 8,987 7,513 51,443<br />
ROACE as a percentage 40% 28% 11% 27%<br />
180 TOTAL - <strong>Registration</strong> <strong>Document</strong> <strong>2005</strong>