Registration Document 2005 - Total.com
Registration Document 2005 - Total.com
Registration Document 2005 - Total.com

You also want an ePaper? Increase the reach of your titles
YUMPU automatically turns print PDFs into web optimized ePapers that Google loves.
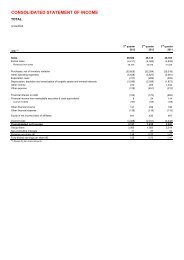
9<br />
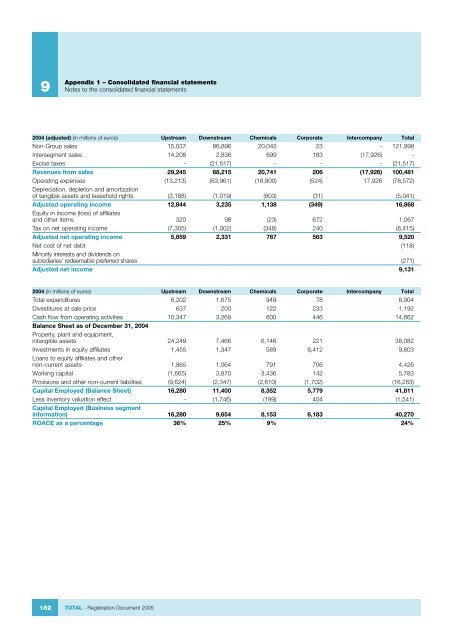
Appendix 1 – Consolidated financial statements<br />
Notes to the consolidated financial statements<br />
2004 (adjusted) (in millions of euros) Upstream Downstream Chemicals Corporate Inter<strong>com</strong>pany <strong>Total</strong><br />
Non-Group sales 15,037 86,896 20,042 23 - 121,998<br />
Intersegment sales 14,208 2,836 699 183 (17,926) -<br />
Excise taxes - (21,517) - - - (21,517)<br />
Revenues from sales 29,245 68,215 20,741 206 (17,926) 100,481<br />
Operating expenses (13,213) (63,961) (18,800) (524) 17,926 (78,572)<br />
Depreciation, depletion and amortization<br />
of tangible assets and leasehold rights (3,188) (1,019) (803) (31) (5,041)<br />
Adjusted operating in<strong>com</strong>e 12,844 3,235 1,138 (349) 16,868<br />
Equity in in<strong>com</strong>e (loss) of affiliates<br />
and other items 320 98 (23) 672 1,067<br />
Tax on net operating in<strong>com</strong>e (7,305) (1,002) (348) 240 (8,415)<br />
Adjusted net operating in<strong>com</strong>e 5,859 2,331 767 563 9,520<br />
Net cost of net debt (118)<br />
Minority interests and dividends on<br />
subsidiaries’ redeemable preferred shares (271)<br />
Adjusted net in<strong>com</strong>e 9,131<br />
2004 (in millions of euros) Upstream Downstream Chemicals Corporate Inter<strong>com</strong>pany <strong>Total</strong><br />
<strong>Total</strong> expenditures 6,202 1,675 949 78 8,904<br />
Divestitures at sale price 637 200 122 233 1,192<br />
Cash flow from operating activities 10,347 3,269 600 446 14,662<br />
Balance Sheet as of December 31, 2004<br />
Property, plant and equipment,<br />
intangible assets 24,249 7,466 6,146 221 38,082<br />
Investments in equity affiliates 1,455 1,347 589 6,412 9,803<br />
Loans to equity affiliates and other<br />
non-current assets 1,865 1,064 791 706 4,426<br />
Working capital (1,665) 3,870 3,436 142 5,783<br />
Provisions and other non-current liabilities (9,624) (2,347) (2,610) (1,702) (16,283)<br />
Capital Employed (Balance Sheet) 16,280 11,400 8,352 5,779 41,811<br />
Less inventory valuation effect - (1,746) (199) 404 (1,541)<br />
Capital Employed (Business segment<br />
information) 16,280 9,654 8,153 6,183 40,270<br />
ROACE as a percentage 36% 25% 9% 24%<br />
182 TOTAL - <strong>Registration</strong> <strong>Document</strong> <strong>2005</strong>