Registration Document 2005 - Total.com
Registration Document 2005 - Total.com
Registration Document 2005 - Total.com

You also want an ePaper? Increase the reach of your titles
YUMPU automatically turns print PDFs into web optimized ePapers that Google loves.
3<br />
Management Report of the Board of Directors<br />
Summary of results and financial position<br />
Summary of results and financial position<br />
Overview of the <strong>2005</strong> fiscal year for TOTAL<br />
Market conditions were favorable for the oil industry in <strong>2005</strong>. In a<br />
context of continued demand growth, the tension on production<br />
capacity, aggravated by the effect of hurricanes in the Gulf of<br />
Mexico, raised oil prices and refining margins to high levels.<br />
Adjusted net in<strong>com</strong>e (1) rose to 12,003 million euros in <strong>2005</strong>, an<br />
increase of 31% <strong>com</strong>pared to 2004. Adjusted earnings per share<br />
increased by 35%, reflecting the Group’s ability to benefit from the<br />
stronger market environment despite inflationary pressure from<br />
service <strong>com</strong>panies. TOTAL’s performance ranks among the best of<br />
the majors in terms of the increase in adjusted earnings per share<br />
and in terms of return on capital employed, which rose to 27% in<br />
<strong>2005</strong> versus 24% in 2004 and 19% in 2003.<br />
Continued exploration success, the launching of Yemen LNG and<br />
the acquisition of Deer Creek in Canada, among other things, have<br />
allowed the Group to increase the level of proved and probable<br />
reserves (2) to 20 billion equivalent barrels at the end of <strong>2005</strong>, which<br />
represents close to 22 years of production at the current rate.<br />
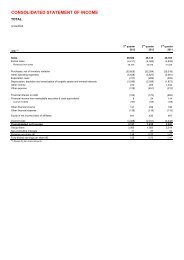
<strong>2005</strong> results<br />
(in millions of euros) <strong>2005</strong><br />
IFRS<br />
62 TOTAL - <strong>Registration</strong> <strong>Document</strong> <strong>2005</strong><br />
The Group invested 13.9 billion dollars in <strong>2005</strong> (3) , a 26% increase<br />
<strong>com</strong>pared to 2004. Investments are expected to continue at<br />
<strong>com</strong>parable levels from now through 2010 and should allow the<br />
Group mainly to increase production by close to 4% per year on<br />
average over the <strong>2005</strong>-2010 period in a 40 $/b Brent environment.<br />
It should also allow the Group to upgrade its refining system in<br />
Europe and the US to adapt to changes in the supply-demand<br />
balance as well as to expand its petrochemical activities in Asia.<br />
Since the beginning of 2006, the Group has had a number of<br />
exploration successes, notably in Africa and in Australia. The<br />
Tyrihans project in Norway was launched with an expected<br />
start-up date in 2009. TOTAL has also signed an agreement<br />
with PetroChina for the development of the onshore Sulige Block<br />
in China.<br />
2004<br />
IFRS<br />
2004<br />
French GAAP<br />
2003<br />
French GAAP<br />
Sales 143,168 121,998 122,700 104,652<br />
Adjusted operating in<strong>com</strong>e from business segments 23,669 17,217 17,123 13,004<br />
Net adjusted operating in<strong>com</strong>e from business segments 11,902 8,957 8,792 6,973<br />
Adjusted net in<strong>com</strong>e 12,003 9,131 9,039 7,344<br />
Net in<strong>com</strong>e (Group share) 12,273 10,868 9,612 7,025<br />
Earnings per share (euros) (4) (5) 20.33 15.05 14.68 11.56<br />
Cash flow from operations 14,669 14,662 14,429 12,487<br />
Investments 11,195 8,904 8,668 7,728<br />
Divestments at selling price 1,088 1,192 1,192 1,878<br />
Return on average capital employed 27% 24% 24% 19%<br />
Return on equity 35% 33% 31% 26%<br />
Number of fully-diluted weighted-average shares (in millions) 590.5 606.6 615.9 635.1<br />
(1) Adjusted IFRS results (adjusted operating result, adjusted net operating result, adjusted net in<strong>com</strong>e, adjusted earnings per share) are defined as the results using replacement cost<br />
(Group share) adjusted for special items and excluding <strong>Total</strong>’s share of amortization of intangibles related to the Sanofi-Aventis merger.<br />
(2) Limited to proved and probable reserves covered by E&P contracts on fields that have been drilled and for which technical studies have demonstrated economic development<br />
in a 40 $/b Brent environment, including the portion of heavy oil in the Joslyn field developed by mining.<br />
(3) Dollar amounts represent euro amounts converted at the average €/$ exchange rate for the period (1.2441 for <strong>2005</strong> and 1.2439 for 2004).<br />
(4) Under IFRS : excluding special items, inventory effect and TOTAL’s equity share of amortization of intangibles related to the Sanofi-Aventis merger.<br />
(5) Under French GAAP : excluding special items and TOTAL’s equity share of amortization of intangibles and goodwills related to the Sanofi-Aventis merger.