Chapter 1, The Reptilian Spectacle - UWSpace - University of ...
Chapter 1, The Reptilian Spectacle - UWSpace - University of ...
Chapter 1, The Reptilian Spectacle - UWSpace - University of ...

You also want an ePaper? Increase the reach of your titles
YUMPU automatically turns print PDFs into web optimized ePapers that Google loves.
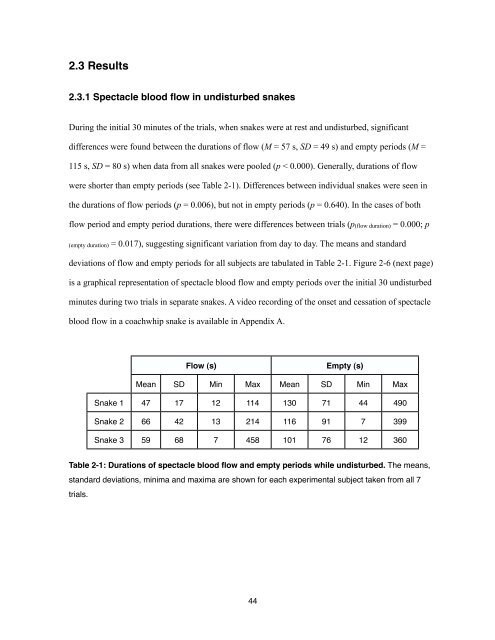
2.3 Results<br />
2.3.1 <strong>Spectacle</strong> blood flow in undisturbed snakes<br />
During the initial 30 minutes <strong>of</strong> the trials, when snakes were at rest and undisturbed, significant<br />
differences were found between the durations <strong>of</strong> flow (M = 57 s, SD = 49 s) and empty periods (M =<br />
115 s, SD = 80 s) when data from all snakes were pooled (p < 0.000). Generally, durations <strong>of</strong> flow<br />
were shorter than empty periods (see Table 2-1). Differences between individual snakes were seen in<br />
the durations <strong>of</strong> flow periods (p = 0.006), but not in empty periods (p = 0.640). In the cases <strong>of</strong> both<br />
flow period and empty period durations, there were differences between trials (p(flow duration) = 0.000; p<br />
(empty duration) = 0.017), suggesting significant variation from day to day. <strong>The</strong> means and standard<br />
deviations <strong>of</strong> flow and empty periods for all subjects are tabulated in Table 2-1. Figure 2-6 (next page)<br />
is a graphical representation <strong>of</strong> spectacle blood flow and empty periods over the initial 30 undisturbed<br />
minutes during two trials in separate snakes. A video recording <strong>of</strong> the onset and cessation <strong>of</strong> spectacle<br />
blood flow in a coachwhip snake is available in Appendix A.<br />
Flow (s) Empty (s)<br />
Mean SD Min Max Mean SD Min Max<br />
Snake 1 47 17 12 114 130 71 44 490<br />
Snake 2 66 42 13 214 116 91 7 399<br />
Snake 3 59 68 7 458 101 76 12 360<br />
Table 2-1: Durations <strong>of</strong> spectacle blood flow and empty periods while undisturbed. <strong>The</strong> means,<br />
standard deviations, minima and maxima are shown for each experimental subject taken from all 7<br />
trials.<br />
44