Chapter 1, The Reptilian Spectacle - UWSpace - University of ...
Chapter 1, The Reptilian Spectacle - UWSpace - University of ...
Chapter 1, The Reptilian Spectacle - UWSpace - University of ...

Create successful ePaper yourself
Turn your PDF publications into a flip-book with our unique Google optimized e-Paper software.
3.3 Results<br />
3.3.1 Snake <strong>Spectacle</strong> Scale Transmittance<br />
<strong>The</strong> spectral transmittance curves <strong>of</strong> every snake sample measured in this study are plotted in Figure<br />
3-1, which, although cluttered, clearly shows the variation encountered. With most species, the<br />
spectacle scales exhibit relatively high transmittance throughout the so-called visual spectrum. A<br />
gradual tapering from 750 nm is evident and could possibly be accounted for by an increase in scatter<br />
with shorter wavelengths due to scratches and irregularities on either surface <strong>of</strong> the scale. As well,<br />
though great care was taken to properly center the scales in the scanning beam’s path, slight<br />
decentration would reduce the measured transmittance due to refraction. Within the ultraviolet (UV)<br />
range (i.e. < 400 nm), significant variation is apparent in the pr<strong>of</strong>iles, with the degree <strong>of</strong> tapering and<br />
the cut<strong>of</strong>f wavelengths varying noticeably between species and families. Means, minima and maxima<br />
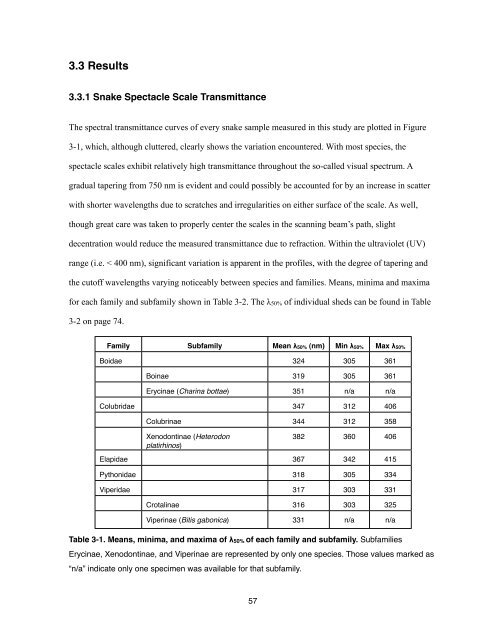
for each family and subfamily shown in Table 3-2. <strong>The</strong> λ50% <strong>of</strong> individual sheds can be found in Table<br />
3-2 on page 74.<br />
Family Subfamily Mean λ50% (nm) Min λ50% Max λ50%<br />
Boidae 324 305 361<br />
Boinae 319 305 361<br />
Erycinae (Charina bottae) 351 n/a n/a<br />
Colubridae 347 312 406<br />
Colubrinae 344 312 358<br />
Xenodontinae (Heterodon<br />
platirhinos)<br />
382 360 406<br />
Elapidae 367 342 415<br />
Pythonidae 318 305 334<br />
Viperidae 317 303 331<br />
Crotalinae 316 303 325<br />
Viperinae (Bitis gabonica) 331 n/a n/a<br />
Table 3-1. Means, minima, and maxima <strong>of</strong> λ50% <strong>of</strong> each family and subfamily. Subfamilies<br />
Erycinae, Xenodontinae, and Viperinae are represented by only one species. Those values marked as<br />
“n/a” indicate only one specimen was available for that subfamily.<br />
57