Chapter 1, The Reptilian Spectacle - UWSpace - University of ...
Chapter 1, The Reptilian Spectacle - UWSpace - University of ...
Chapter 1, The Reptilian Spectacle - UWSpace - University of ...

Create successful ePaper yourself
Turn your PDF publications into a flip-book with our unique Google optimized e-Paper software.
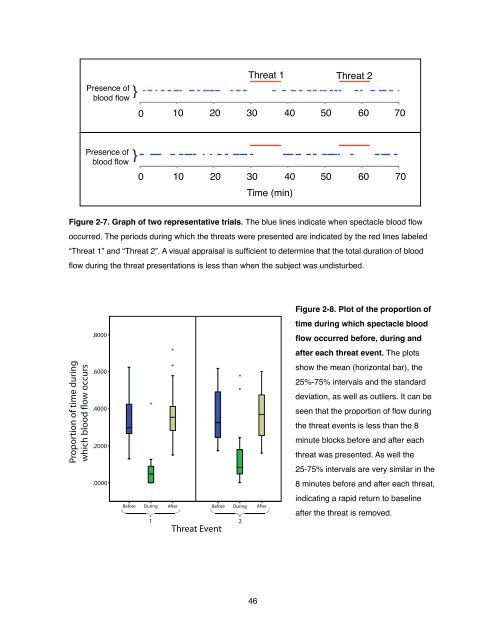
Figure 2-7. Graph <strong>of</strong> two representative trials. <strong>The</strong> blue lines indicate when spectacle blood flow<br />
occurred. <strong>The</strong> periods during which the threats were presented are indicated by the red lines labeled<br />
“Threat 1” and “Threat 2”. A visual appraisal is sufficient to determine that the total duration <strong>of</strong> blood<br />
flow during the threat presentations is less than when the subject was undisturbed.<br />
Proportion <strong>of</strong> time during<br />
which blood ow occurs<br />
Presence <strong>of</strong><br />
blood flow }<br />
Presence <strong>of</strong><br />
blood flow }<br />
.8000<br />
.6000<br />
.4000<br />
.2000<br />
.0000<br />
Threat 1 Threat 2<br />
0 10 20 30 40 50 60 70<br />
0 10 20 30 40 50 60 70<br />
*<br />
1<br />
*<br />
*<br />
Before During After Before During After<br />
Threat Event<br />
*<br />
*<br />
2<br />
Time (min)<br />
46<br />
Figure 2-8. Plot <strong>of</strong> the proportion <strong>of</strong><br />
time during which spectacle blood<br />
flow occurred before, during and<br />
after each threat event. <strong>The</strong> plots<br />
show the mean (horizontal bar), the<br />
25%-75% intervals and the standard<br />
deviation, as well as outliers. It can be<br />
seen that the proportion <strong>of</strong> flow during<br />
the threat events is less than the 8<br />
minute blocks before and after each<br />
threat was presented. As well the<br />
25-75% intervals are very similar in the<br />
8 minutes before and after each threat,<br />
indicating a rapid return to baseline<br />
after the threat is removed.