Regulation of Fuels and Fuel Additives: Renewable Fuel Standard ...
Regulation of Fuels and Fuel Additives: Renewable Fuel Standard ...
Regulation of Fuels and Fuel Additives: Renewable Fuel Standard ...

You also want an ePaper? Increase the reach of your titles
YUMPU automatically turns print PDFs into web optimized ePapers that Google loves.
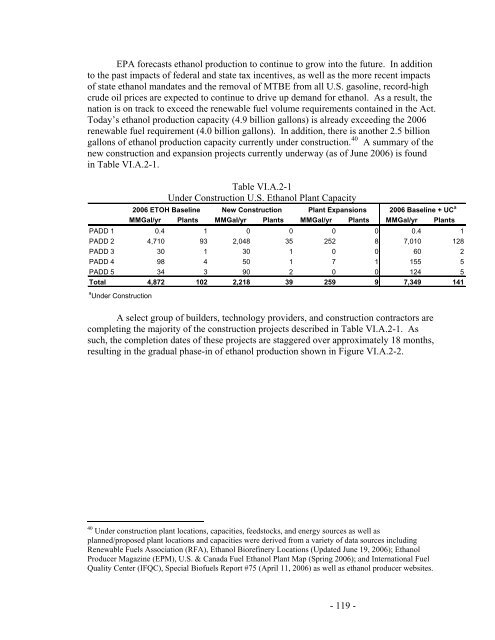
EPA forecasts ethanol production to continue to grow into the future. In addition<br />
to the past impacts <strong>of</strong> federal <strong>and</strong> state tax incentives, as well as the more recent impacts<br />
<strong>of</strong> state ethanol m<strong>and</strong>ates <strong>and</strong> the removal <strong>of</strong> MTBE from all U.S. gasoline, record-high<br />
crude oil prices are expected to continue to drive up dem<strong>and</strong> for ethanol. As a result, the<br />
nation is on track to exceed the renewable fuel volume requirements contained in the Act.<br />
Today’s ethanol production capacity (4.9 billion gallons) is already exceeding the 2006<br />
renewable fuel requirement (4.0 billion gallons). In addition, there is another 2.5 billion<br />
gallons <strong>of</strong> ethanol production capacity currently under construction. 40 A summary <strong>of</strong> the<br />
new construction <strong>and</strong> expansion projects currently underway (as <strong>of</strong> June 2006) is found<br />
in Table VI.A.2-1.<br />
Table VI.A.2-1<br />
Under Construction U.S. Ethanol Plant Capacity<br />
2006 ETOH Baseline New Construction 2006 Baseline + UC<br />
MMGal/yr Plants MMGal/yr Plants MMGal/yr Plants MMGal/yr Plants<br />
a<br />
Plant Expansions<br />
PADD 1 0.4 1 0 0 0 0 0.4 1<br />
PADD 2 4,710 93 2,048 35 252 8 7,010 128<br />
PADD 3 30 1 30 1 0 0 60 2<br />
PADD 4 98 4 50 1 7 1 155 5<br />
PADD 5 34 3 90 2 0 0 124 5<br />
Total 4,872 102 2,218 39 259 9 7,349 141<br />
a Under Construction<br />
A select group <strong>of</strong> builders, technology providers, <strong>and</strong> construction contractors are<br />
completing the majority <strong>of</strong> the construction projects described in Table VI.A.2-1. As<br />
such, the completion dates <strong>of</strong> these projects are staggered over approximately 18 months,<br />
resulting in the gradual phase-in <strong>of</strong> ethanol production shown in Figure VI.A.2-2.<br />
40 Under construction plant locations, capacities, feedstocks, <strong>and</strong> energy sources as well as<br />
planned/proposed plant locations <strong>and</strong> capacities were derived from a variety <strong>of</strong> data sources including<br />
<strong>Renewable</strong> <strong><strong>Fuel</strong>s</strong> Association (RFA), Ethanol Biorefinery Locations (Updated June 19, 2006); Ethanol<br />
Producer Magazine (EPM), U.S. & Canada <strong>Fuel</strong> Ethanol Plant Map (Spring 2006); <strong>and</strong> International <strong>Fuel</strong><br />
Quality Center (IFQC), Special Bi<strong>of</strong>uels Report #75 (April 11, 2006) as well as ethanol producer websites.<br />
- 119 -