Regulation of Fuels and Fuel Additives: Renewable Fuel Standard ...
Regulation of Fuels and Fuel Additives: Renewable Fuel Standard ...
Regulation of Fuels and Fuel Additives: Renewable Fuel Standard ...

You also want an ePaper? Increase the reach of your titles
YUMPU automatically turns print PDFs into web optimized ePapers that Google loves.
RFG due to the absence <strong>of</strong> an RVP waiver for ethanol blends. The reader is referred to<br />
Chapter 2 <strong>of</strong> the DRIA for discussion <strong>of</strong> how ethanol levels will change at the state-level.<br />
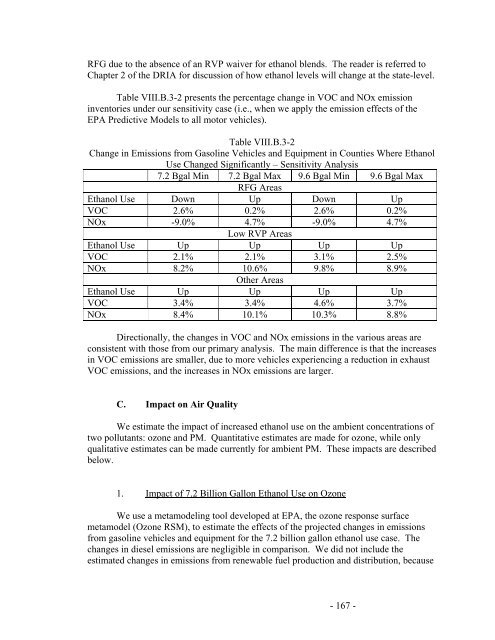
Table VIII.B.3-2 presents the percentage change in VOC <strong>and</strong> NOx emission<br />
inventories under our sensitivity case (i.e., when we apply the emission effects <strong>of</strong> the<br />
EPA Predictive Models to all motor vehicles).<br />
Table VIII.B.3-2<br />
Change in Emissions from Gasoline Vehicles <strong>and</strong> Equipment in Counties Where Ethanol<br />
Use Changed Significantly – Sensitivity Analysis<br />
7.2 Bgal Min 7.2 Bgal Max 9.6 Bgal Min 9.6 Bgal Max<br />
RFG Areas<br />
Ethanol Use Down Up Down Up<br />
VOC 2.6% 0.2% 2.6% 0.2%<br />
NOx -9.0% 4.7% -9.0% 4.7%<br />
Low RVP Areas<br />
Ethanol Use Up Up Up Up<br />
VOC 2.1% 2.1% 3.1% 2.5%<br />
NOx 8.2% 10.6% 9.8% 8.9%<br />
Other Areas<br />
Ethanol Use Up Up Up Up<br />
VOC 3.4% 3.4% 4.6% 3.7%<br />
NOx 8.4% 10.1% 10.3% 8.8%<br />
Directionally, the changes in VOC <strong>and</strong> NOx emissions in the various areas are<br />
consistent with those from our primary analysis. The main difference is that the increases<br />
in VOC emissions are smaller, due to more vehicles experiencing a reduction in exhaust<br />
VOC emissions, <strong>and</strong> the increases in NOx emissions are larger.<br />
C. Impact on Air Quality<br />
We estimate the impact <strong>of</strong> increased ethanol use on the ambient concentrations <strong>of</strong><br />
two pollutants: ozone <strong>and</strong> PM. Quantitative estimates are made for ozone, while only<br />
qualitative estimates can be made currently for ambient PM. These impacts are described<br />
below.<br />
1. Impact <strong>of</strong> 7.2 Billion Gallon Ethanol Use on Ozone<br />
We use a metamodeling tool developed at EPA, the ozone response surface<br />
metamodel (Ozone RSM), to estimate the effects <strong>of</strong> the projected changes in emissions<br />
from gasoline vehicles <strong>and</strong> equipment for the 7.2 billion gallon ethanol use case. The<br />
changes in diesel emissions are negligible in comparison. We did not include the<br />
estimated changes in emissions from renewable fuel production <strong>and</strong> distribution, because<br />
- 167 -