Regulation of Fuels and Fuel Additives: Renewable Fuel Standard ...
Regulation of Fuels and Fuel Additives: Renewable Fuel Standard ...
Regulation of Fuels and Fuel Additives: Renewable Fuel Standard ...

You also want an ePaper? Increase the reach of your titles
YUMPU automatically turns print PDFs into web optimized ePapers that Google loves.
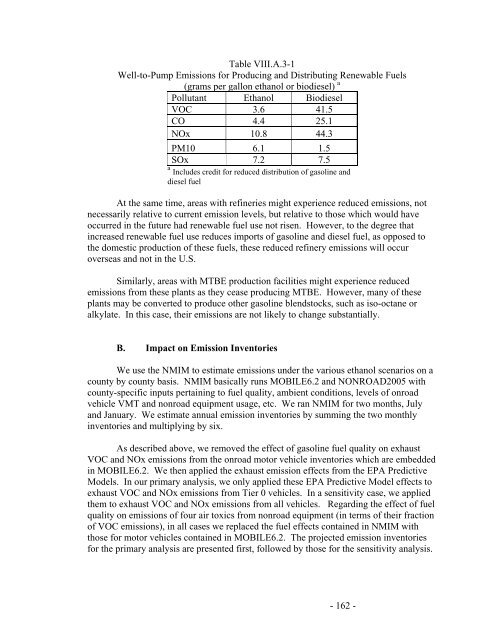
Table VIII.A.3-1<br />
Well-to-Pump Emissions for Producing <strong>and</strong> Distributing <strong>Renewable</strong> <strong><strong>Fuel</strong>s</strong><br />
(grams per gallon ethanol or biodiesel) a<br />
Pollutant Ethanol Biodiesel<br />
VOC 3.6 41.5<br />
CO 4.4 25.1<br />
NOx 10.8 44.3<br />
PM10 6.1 1.5<br />
SOx 7.2 7.5<br />
a Includes credit for reduced distribution <strong>of</strong> gasoline <strong>and</strong><br />
diesel fuel<br />
At the same time, areas with refineries might experience reduced emissions, not<br />
necessarily relative to current emission levels, but relative to those which would have<br />
occurred in the future had renewable fuel use not risen. However, to the degree that<br />
increased renewable fuel use reduces imports <strong>of</strong> gasoline <strong>and</strong> diesel fuel, as opposed to<br />
the domestic production <strong>of</strong> these fuels, these reduced refinery emissions will occur<br />
overseas <strong>and</strong> not in the U.S.<br />
Similarly, areas with MTBE production facilities might experience reduced<br />
emissions from these plants as they cease producing MTBE. However, many <strong>of</strong> these<br />
plants may be converted to produce other gasoline blendstocks, such as iso-octane or<br />
alkylate. In this case, their emissions are not likely to change substantially.<br />
B. Impact on Emission Inventories<br />
We use the NMIM to estimate emissions under the various ethanol scenarios on a<br />
county by county basis. NMIM basically runs MOBILE6.2 <strong>and</strong> NONROAD2005 with<br />
county-specific inputs pertaining to fuel quality, ambient conditions, levels <strong>of</strong> onroad<br />
vehicle VMT <strong>and</strong> nonroad equipment usage, etc. We ran NMIM for two months, July<br />
<strong>and</strong> January. We estimate annual emission inventories by summing the two monthly<br />
inventories <strong>and</strong> multiplying by six.<br />
As described above, we removed the effect <strong>of</strong> gasoline fuel quality on exhaust<br />
VOC <strong>and</strong> NOx emissions from the onroad motor vehicle inventories which are embedded<br />
in MOBILE6.2. We then applied the exhaust emission effects from the EPA Predictive<br />
Models. In our primary analysis, we only applied these EPA Predictive Model effects to<br />
exhaust VOC <strong>and</strong> NOx emissions from Tier 0 vehicles. In a sensitivity case, we applied<br />
them to exhaust VOC <strong>and</strong> NOx emissions from all vehicles. Regarding the effect <strong>of</strong> fuel<br />
quality on emissions <strong>of</strong> four air toxics from nonroad equipment (in terms <strong>of</strong> their fraction<br />
<strong>of</strong> VOC emissions), in all cases we replaced the fuel effects contained in NMIM with<br />
those for motor vehicles contained in MOBILE6.2. The projected emission inventories<br />
for the primary analysis are presented first, followed by those for the sensitivity analysis.<br />
- 162 -