Regulation of Fuels and Fuel Additives: Renewable Fuel Standard ...
Regulation of Fuels and Fuel Additives: Renewable Fuel Standard ...
Regulation of Fuels and Fuel Additives: Renewable Fuel Standard ...

You also want an ePaper? Increase the reach of your titles
YUMPU automatically turns print PDFs into web optimized ePapers that Google loves.
change from the 2004 base case. 53 In the maximum scenario (“max-RFG”), refineries<br />
would continue to add oxygenate (ethanol) into all batches <strong>of</strong> reformulated gasoline. In<br />
this case, refineries currently blending MTBE (at 11 volume percent) would be expected<br />
to replace it with ethanol (at 10 volume percent). In the minimum scenario (“min-RFG”),<br />
we predict some refineries would respond by using less (or even zero) ethanol in RFG<br />
based on the minimum amount needed to meet volume, octane, <strong>and</strong>/or total toxics<br />
performance requirements. Applying the max-RFG <strong>and</strong> min-RFG criteria resulted in a<br />
total <strong>of</strong> four different 2012 ethanol consumption control cases:<br />
1. 7.2 billion gallons <strong>of</strong> ethanol, maximum amount used in RFG areas;<br />
2. 7.2 billion gallons <strong>of</strong> ethanol, minimum amount used in RFG areas;<br />
3. 9.6 billion gallons <strong>of</strong> ethanol, maximum amount used in RFG areas; <strong>and</strong><br />
4. 9.6 billion gallons <strong>of</strong> ethanol, minimum amount used in RFG areas.<br />
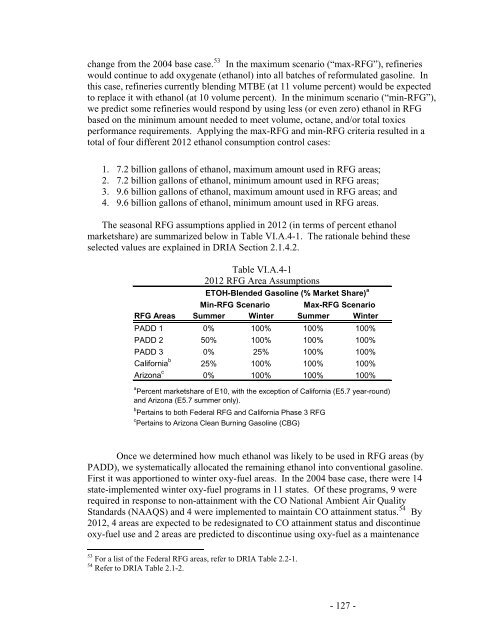
The seasonal RFG assumptions applied in 2012 (in terms <strong>of</strong> percent ethanol<br />
marketshare) are summarized below in Table VI.A.4-1. The rationale behind these<br />
selected values are explained in DRIA Section 2.1.4.2.<br />
Table VI.A.4-1<br />
2012 RFG Area Assumptions<br />
ETOH-Blended Gasoline (% Market Share) a<br />
RFG Areas Summer Winter Summer Winter<br />
PADD 1 0% 100% 100% 100%<br />
PADD 2 50% 100% 100% 100%<br />
PADD 3 0% 25% 100% 100%<br />
California b<br />
25% 100% 100% 100%<br />
Arizona c<br />
Min-RFG Scenario Max-RFG Scenario<br />
0% 100% 100% 100%<br />
a<br />
Percent marketshare <strong>of</strong> E10, with the exception <strong>of</strong> California (E5.7 year-round)<br />
<strong>and</strong> Arizona (E5.7 summer only).<br />
b<br />
Pertains to both Federal RFG <strong>and</strong> California Phase 3 RFG<br />
c<br />
Pertains to Arizona Clean Burning Gasoline (CBG)<br />
Once we determined how much ethanol was likely to be used in RFG areas (by<br />
PADD), we systematically allocated the remaining ethanol into conventional gasoline.<br />
First it was apportioned to winter oxy-fuel areas. In the 2004 base case, there were 14<br />
state-implemented winter oxy-fuel programs in 11 states. Of these programs, 9 were<br />
required in response to non-attainment with the CO National Ambient Air Quality<br />
St<strong>and</strong>ards (NAAQS) <strong>and</strong> 4 were implemented to maintain CO attainment status. 54 By<br />
2012, 4 areas are expected to be redesignated to CO attainment status <strong>and</strong> discontinue<br />
oxy-fuel use <strong>and</strong> 2 areas are predicted to discontinue using oxy-fuel as a maintenance<br />
53 For a list <strong>of</strong> the Federal RFG areas, refer to DRIA Table 2.2-1.<br />
54 Refer to DRIA Table 2.1-2.<br />
- 127 -