Regulation of Fuels and Fuel Additives: Renewable Fuel Standard ...
Regulation of Fuels and Fuel Additives: Renewable Fuel Standard ...
Regulation of Fuels and Fuel Additives: Renewable Fuel Standard ...

Create successful ePaper yourself
Turn your PDF publications into a flip-book with our unique Google optimized e-Paper software.
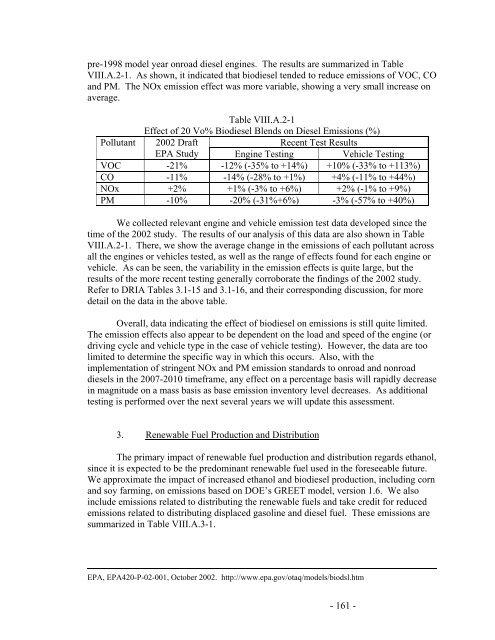
pre-1998 model year onroad diesel engines. The results are summarized in Table<br />
VIII.A.2-1. As shown, it indicated that biodiesel tended to reduce emissions <strong>of</strong> VOC, CO<br />
<strong>and</strong> PM. The NOx emission effect was more variable, showing a very small increase on<br />
average.<br />
Table VIII.A.2-1<br />
Effect <strong>of</strong> 20 Vo% Biodiesel Blends on Diesel Emissions (%)<br />
Pollutant 2002 Draft<br />
Recent Test Results<br />
EPA Study Engine Testing Vehicle Testing<br />
VOC -21% -12% (-35% to +14%) +10% (-33% to +113%)<br />
CO -11% -14% (-28% to +1%) +4% (-11% to +44%)<br />
NOx +2% +1% (-3% to +6%) +2% (-1% to +9%)<br />
PM -10% -20% (-31%+6%) -3% (-57% to +40%)<br />
We collected relevant engine <strong>and</strong> vehicle emission test data developed since the<br />
time <strong>of</strong> the 2002 study. The results <strong>of</strong> our analysis <strong>of</strong> this data are also shown in Table<br />
VIII.A.2-1. There, we show the average change in the emissions <strong>of</strong> each pollutant across<br />
all the engines or vehicles tested, as well as the range <strong>of</strong> effects found for each engine or<br />
vehicle. As can be seen, the variability in the emission effects is quite large, but the<br />
results <strong>of</strong> the more recent testing generally corroborate the findings <strong>of</strong> the 2002 study.<br />
Refer to DRIA Tables 3.1-15 <strong>and</strong> 3.1-16, <strong>and</strong> their corresponding discussion, for more<br />
detail on the data in the above table.<br />
Overall, data indicating the effect <strong>of</strong> biodiesel on emissions is still quite limited.<br />
The emission effects also appear to be dependent on the load <strong>and</strong> speed <strong>of</strong> the engine (or<br />
driving cycle <strong>and</strong> vehicle type in the case <strong>of</strong> vehicle testing). However, the data are too<br />
limited to determine the specific way in which this occurs. Also, with the<br />
implementation <strong>of</strong> stringent NOx <strong>and</strong> PM emission st<strong>and</strong>ards to onroad <strong>and</strong> nonroad<br />
diesels in the 2007-2010 timeframe, any effect on a percentage basis will rapidly decrease<br />
in magnitude on a mass basis as base emission inventory level decreases. As additional<br />
testing is performed over the next several years we will update this assessment.<br />
3. <strong>Renewable</strong> <strong>Fuel</strong> Production <strong>and</strong> Distribution<br />
The primary impact <strong>of</strong> renewable fuel production <strong>and</strong> distribution regards ethanol,<br />
since it is expected to be the predominant renewable fuel used in the foreseeable future.<br />
We approximate the impact <strong>of</strong> increased ethanol <strong>and</strong> biodiesel production, including corn<br />
<strong>and</strong> soy farming, on emissions based on DOE’s GREET model, version 1.6. We also<br />
include emissions related to distributing the renewable fuels <strong>and</strong> take credit for reduced<br />
emissions related to distributing displaced gasoline <strong>and</strong> diesel fuel. These emissions are<br />
summarized in Table VIII.A.3-1.<br />
EPA, EPA420-P-02-001, October 2002. http://www.epa.gov/otaq/models/biodsl.htm<br />
- 161 -