Regulation of Fuels and Fuel Additives: Renewable Fuel Standard ...
Regulation of Fuels and Fuel Additives: Renewable Fuel Standard ...
Regulation of Fuels and Fuel Additives: Renewable Fuel Standard ...

You also want an ePaper? Increase the reach of your titles
YUMPU automatically turns print PDFs into web optimized ePapers that Google loves.
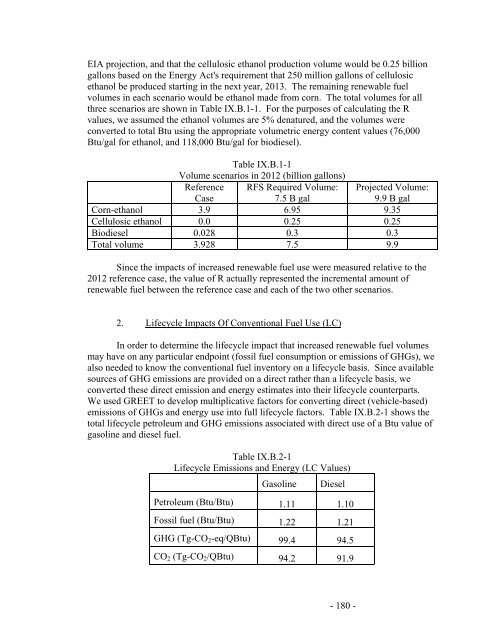
EIA projection, <strong>and</strong> that the cellulosic ethanol production volume would be 0.25 billion<br />
gallons based on the Energy Act's requirement that 250 million gallons <strong>of</strong> cellulosic<br />
ethanol be produced starting in the next year, 2013. The remaining renewable fuel<br />
volumes in each scenario would be ethanol made from corn. The total volumes for all<br />
three scenarios are shown in Table IX.B.1-1. For the purposes <strong>of</strong> calculating the R<br />
values, we assumed the ethanol volumes are 5% denatured, <strong>and</strong> the volumes were<br />
converted to total Btu using the appropriate volumetric energy content values (76,000<br />
Btu/gal for ethanol, <strong>and</strong> 118,000 Btu/gal for biodiesel).<br />
Table IX.B.1-1<br />
Volume scenarios in 2012 (billion gallons)<br />
Reference RFS Required Volume: Projected Volume:<br />
Case<br />
7.5 B gal<br />
9.9 B gal<br />
Corn-ethanol 3.9 6.95 9.35<br />
Cellulosic ethanol 0.0 0.25 0.25<br />
Biodiesel 0.028<br />
0.3 0.3<br />
Total volume 3.928 7.5 9.9<br />
Since the impacts <strong>of</strong> increased renewable fuel use were measured relative to the<br />
2012 reference case, the value <strong>of</strong> R actually represented the incremental amount <strong>of</strong><br />
renewable fuel between the reference case <strong>and</strong> each <strong>of</strong> the two other scenarios.<br />
2. Lifecycle Impacts Of Conventional <strong>Fuel</strong> Use (LC)<br />
In order to determine the lifecycle impact that increased renewable fuel volumes<br />
may have on any particular endpoint (fossil fuel consumption or emissions <strong>of</strong> GHGs), we<br />
also needed to know the conventional fuel inventory on a lifecycle basis. Since available<br />
sources <strong>of</strong> GHG emissions are provided on a direct rather than a lifecycle basis, we<br />
converted these direct emission <strong>and</strong> energy estimates into their lifecycle counterparts.<br />
We used GREET to develop multiplicative factors for converting direct (vehicle-based)<br />
emissions <strong>of</strong> GHGs <strong>and</strong> energy use into full lifecycle factors. Table IX.B.2-1 shows the<br />
total lifecycle petroleum <strong>and</strong> GHG emissions associated with direct use <strong>of</strong> a Btu value <strong>of</strong><br />
gasoline <strong>and</strong> diesel fuel.<br />
Table IX.B.2-1<br />
Lifecycle Emissions <strong>and</strong> Energy (LC Values)<br />
Gasoline Diesel<br />
Petroleum (Btu/Btu) 1.11 1.10<br />
Fossil fuel (Btu/Btu) 1.22 1.21<br />
GHG (Tg-CO2-eq/QBtu) 99.4 94.5<br />
CO2 (Tg-CO2/QBtu) 94.2 91.9<br />
- 180 -