Regulation of Fuels and Fuel Additives: Renewable Fuel Standard ...
Regulation of Fuels and Fuel Additives: Renewable Fuel Standard ...
Regulation of Fuels and Fuel Additives: Renewable Fuel Standard ...

You also want an ePaper? Increase the reach of your titles
YUMPU automatically turns print PDFs into web optimized ePapers that Google loves.
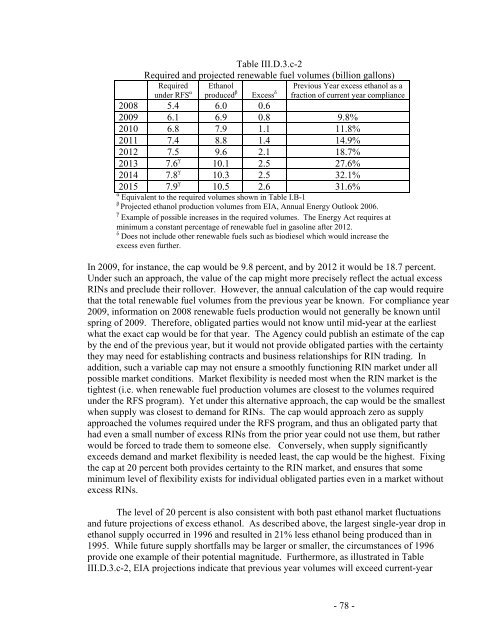
Table III.D.3.c-2<br />
Required <strong>and</strong> projected renewable fuel volumes (billion gallons)<br />
Required<br />
under RFS α<br />
Ethanol<br />
produced β<br />
Excess δ<br />
Previous Year excess ethanol as a<br />
fraction <strong>of</strong> current year compliance<br />
2008 5.4 6.0 0.6<br />
2009 6.1 6.9 0.8 9.8%<br />
2010 6.8 7.9 1.1 11.8%<br />
2011 7.4 8.8 1.4 14.9%<br />
2012 7.5 9.6 2.1 18.7%<br />
2013 7.6 γ<br />
10.1 2.5 27.6%<br />
2014 7.8 γ<br />
10.3 2.5 32.1%<br />
2015 7.9 γ<br />
10.5 2.6 31.6%<br />
α Equivalent to the required volumes shown in Table I.B-1<br />
β Projected ethanol production volumes from EIA, Annual Energy Outlook 2006.<br />
γ Example <strong>of</strong> possible increases in the required volumes. The Energy Act requires at<br />
minimum a constant percentage <strong>of</strong> renewable fuel in gasoline after 2012.<br />
δ Does not include other renewable fuels such as biodiesel which would increase the<br />
excess even further.<br />
In 2009, for instance, the cap would be 9.8 percent, <strong>and</strong> by 2012 it would be 18.7 percent.<br />
Under such an approach, the value <strong>of</strong> the cap might more precisely reflect the actual excess<br />
RINs <strong>and</strong> preclude their rollover. However, the annual calculation <strong>of</strong> the cap would require<br />
that the total renewable fuel volumes from the previous year be known. For compliance year<br />
2009, information on 2008 renewable fuels production would not generally be known until<br />
spring <strong>of</strong> 2009. Therefore, obligated parties would not know until mid-year at the earliest<br />
what the exact cap would be for that year. The Agency could publish an estimate <strong>of</strong> the cap<br />
by the end <strong>of</strong> the previous year, but it would not provide obligated parties with the certainty<br />
they may need for establishing contracts <strong>and</strong> business relationships for RIN trading. In<br />
addition, such a variable cap may not ensure a smoothly functioning RIN market under all<br />
possible market conditions. Market flexibility is needed most when the RIN market is the<br />
tightest (i.e. when renewable fuel production volumes are closest to the volumes required<br />
under the RFS program). Yet under this alternative approach, the cap would be the smallest<br />
when supply was closest to dem<strong>and</strong> for RINs. The cap would approach zero as supply<br />
approached the volumes required under the RFS program, <strong>and</strong> thus an obligated party that<br />
had even a small number <strong>of</strong> excess RINs from the prior year could not use them, but rather<br />
would be forced to trade them to someone else. Conversely, when supply significantly<br />
exceeds dem<strong>and</strong> <strong>and</strong> market flexibility is needed least, the cap would be the highest. Fixing<br />
the cap at 20 percent both provides certainty to the RIN market, <strong>and</strong> ensures that some<br />
minimum level <strong>of</strong> flexibility exists for individual obligated parties even in a market without<br />
excess RINs.<br />
The level <strong>of</strong> 20 percent is also consistent with both past ethanol market fluctuations<br />
<strong>and</strong> future projections <strong>of</strong> excess ethanol. As described above, the largest single-year drop in<br />
ethanol supply occurred in 1996 <strong>and</strong> resulted in 21% less ethanol being produced than in<br />
1995. While future supply shortfalls may be larger or smaller, the circumstances <strong>of</strong> 1996<br />
provide one example <strong>of</strong> their potential magnitude. Furthermore, as illustrated in Table<br />
III.D.3.c-2, EIA projections indicate that previous year volumes will exceed current-year<br />
- 78 -