Regulation of Fuels and Fuel Additives: Renewable Fuel Standard ...
Regulation of Fuels and Fuel Additives: Renewable Fuel Standard ...
Regulation of Fuels and Fuel Additives: Renewable Fuel Standard ...

You also want an ePaper? Increase the reach of your titles
YUMPU automatically turns print PDFs into web optimized ePapers that Google loves.
assumed to be affected by ethanol. Emissions <strong>of</strong> the four air toxics generally decrease<br />
slightly, due to the greater reduction in exhaust VOC emissions.<br />
3. Local <strong>and</strong> Regional VOC <strong>and</strong> NOx Emission Impacts In July<br />
We also estimate the percentage change in VOC <strong>and</strong> NOx emissions from<br />
gasoline fueled motor vehicles <strong>and</strong> equipment in those areas which actually experienced a<br />
significant change in ethanol use. Specifically, we focused on areas where the market<br />
share <strong>of</strong> ethanol blends was projected to change by 50 percent or more. We also focused<br />
on summertime emissions, as these are most relevant to ozone formation. Finally, we<br />
developed separately estimates for: 1) RFG areas, including the state <strong>of</strong> California <strong>and</strong><br />
the portions <strong>of</strong> Arizona where their CBG fuel programs apply, 2) low RVP areas (i.e.,<br />
RVP st<strong>and</strong>ards less than 9.0 RVP, <strong>and</strong> 3) areas with a 9.0 RVP st<strong>and</strong>ard. This set <strong>of</strong><br />
groupings helps to highlight the emissions impact <strong>of</strong> increased ethanol use in those areas<br />
where emission control is most important.<br />
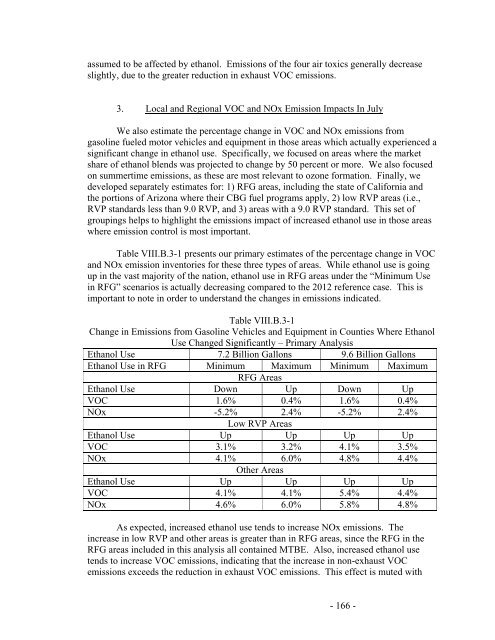
Table VIII.B.3-1 presents our primary estimates <strong>of</strong> the percentage change in VOC<br />
<strong>and</strong> NOx emission inventories for these three types <strong>of</strong> areas. While ethanol use is going<br />
up in the vast majority <strong>of</strong> the nation, ethanol use in RFG areas under the “Minimum Use<br />
in RFG” scenarios is actually decreasing compared to the 2012 reference case. This is<br />
important to note in order to underst<strong>and</strong> the changes in emissions indicated.<br />
Table VIII.B.3-1<br />
Change in Emissions from Gasoline Vehicles <strong>and</strong> Equipment in Counties Where Ethanol<br />
Use Changed Significantly – Primary Analysis<br />
Ethanol Use 7.2 Billion Gallons 9.6 Billion Gallons<br />
Ethanol Use in RFG Minimum Maximum Minimum Maximum<br />
RFG Areas<br />
Ethanol Use Down Up Down Up<br />
VOC 1.6% 0.4% 1.6% 0.4%<br />
NOx -5.2% 2.4% -5.2% 2.4%<br />
Low RVP Areas<br />
Ethanol Use Up Up Up Up<br />
VOC 3.1% 3.2% 4.1% 3.5%<br />
NOx 4.1% 6.0% 4.8% 4.4%<br />
Other Areas<br />
Ethanol Use Up Up Up Up<br />
VOC 4.1% 4.1% 5.4% 4.4%<br />
NOx 4.6% 6.0% 5.8% 4.8%<br />
As expected, increased ethanol use tends to increase NOx emissions. The<br />
increase in low RVP <strong>and</strong> other areas is greater than in RFG areas, since the RFG in the<br />
RFG areas included in this analysis all contained MTBE. Also, increased ethanol use<br />
tends to increase VOC emissions, indicating that the increase in non-exhaust VOC<br />
emissions exceeds the reduction in exhaust VOC emissions. This effect is muted with<br />
- 166 -