Regulation of Fuels and Fuel Additives: Renewable Fuel Standard ...
Regulation of Fuels and Fuel Additives: Renewable Fuel Standard ...
Regulation of Fuels and Fuel Additives: Renewable Fuel Standard ...
Create successful ePaper yourself
Turn your PDF publications into a flip-book with our unique Google optimized e-Paper software.
strategy. Accordingly, a reduced amount <strong>of</strong> ethanol was allocated to oxy-fuel areas in<br />
2012. The remaining ethanol was distributed to conventional gasoline (CG) in different<br />
states based on a computed ethanol margin (rack gasoline price minus ethanol delivered<br />
price adjusted by miscellaneous subsidies/penalties). The methodology is described in<br />
DRIA Section 2.1.4.3.<br />
The main difference in the four resulting ethanol consumption scenarios was how<br />
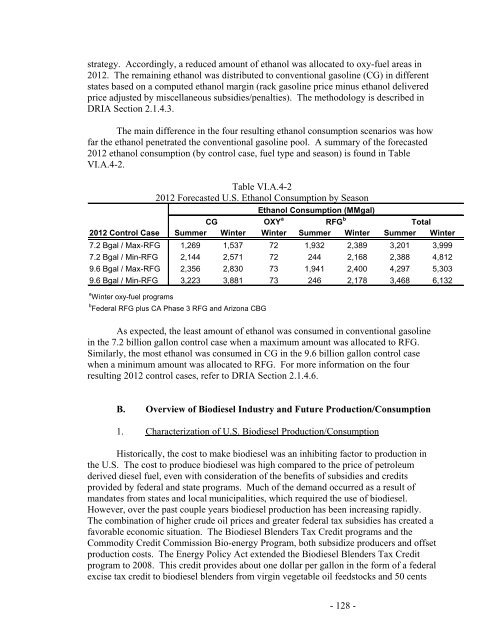
far the ethanol penetrated the conventional gasoline pool. A summary <strong>of</strong> the forecasted<br />
2012 ethanol consumption (by control case, fuel type <strong>and</strong> season) is found in Table<br />
VI.A.4-2.<br />
Table VI.A.4-2<br />
2012 Forecasted U.S. Ethanol Consumption by Season<br />
OXY a<br />
CG RFG<br />
2012 Control Case Summer Winter Winter Summer Winter Summer Winter<br />
7.2 Bgal / Max-RFG 1,269 1,537 72 1,932 2,389 3,201 3,999<br />
7.2 Bgal / Min-RFG 2,144 2,571 72 244 2,168 2,388 4,812<br />
9.6 Bgal / Max-RFG 2,356 2,830 73 1,941 2,400 4,297 5,303<br />
9.6 Bgal / Min-RFG 3,223 3,881 73 246 2,178 3,468 6,132<br />
b<br />
Ethanol Consumption (MMgal)<br />
Total<br />
a<br />
Winter oxy-fuel programs<br />
b<br />
Federal RFG plus CA Phase 3 RFG <strong>and</strong> Arizona CBG<br />
As expected, the least amount <strong>of</strong> ethanol was consumed in conventional gasoline<br />
in the 7.2 billion gallon control case when a maximum amount was allocated to RFG.<br />
Similarly, the most ethanol was consumed in CG in the 9.6 billion gallon control case<br />
when a minimum amount was allocated to RFG. For more information on the four<br />
resulting 2012 control cases, refer to DRIA Section 2.1.4.6.<br />
B. Overview <strong>of</strong> Biodiesel Industry <strong>and</strong> Future Production/Consumption<br />
1. Characterization <strong>of</strong> U.S. Biodiesel Production/Consumption<br />
Historically, the cost to make biodiesel was an inhibiting factor to production in<br />
the U.S. The cost to produce biodiesel was high compared to the price <strong>of</strong> petroleum<br />
derived diesel fuel, even with consideration <strong>of</strong> the benefits <strong>of</strong> subsidies <strong>and</strong> credits<br />
provided by federal <strong>and</strong> state programs. Much <strong>of</strong> the dem<strong>and</strong> occurred as a result <strong>of</strong><br />
m<strong>and</strong>ates from states <strong>and</strong> local municipalities, which required the use <strong>of</strong> biodiesel.<br />
However, over the past couple years biodiesel production has been increasing rapidly.<br />
The combination <strong>of</strong> higher crude oil prices <strong>and</strong> greater federal tax subsidies has created a<br />
favorable economic situation. The Biodiesel Blenders Tax Credit programs <strong>and</strong> the<br />
Commodity Credit Commission Bio-energy Program, both subsidize producers <strong>and</strong> <strong>of</strong>fset<br />
production costs. The Energy Policy Act extended the Biodiesel Blenders Tax Credit<br />
program to 2008. This credit provides about one dollar per gallon in the form <strong>of</strong> a federal<br />
excise tax credit to biodiesel blenders from virgin vegetable oil feedstocks <strong>and</strong> 50 cents<br />
- 128 -


