Regulation of Fuels and Fuel Additives: Renewable Fuel Standard ...
Regulation of Fuels and Fuel Additives: Renewable Fuel Standard ...
Regulation of Fuels and Fuel Additives: Renewable Fuel Standard ...

You also want an ePaper? Increase the reach of your titles
YUMPU automatically turns print PDFs into web optimized ePapers that Google loves.
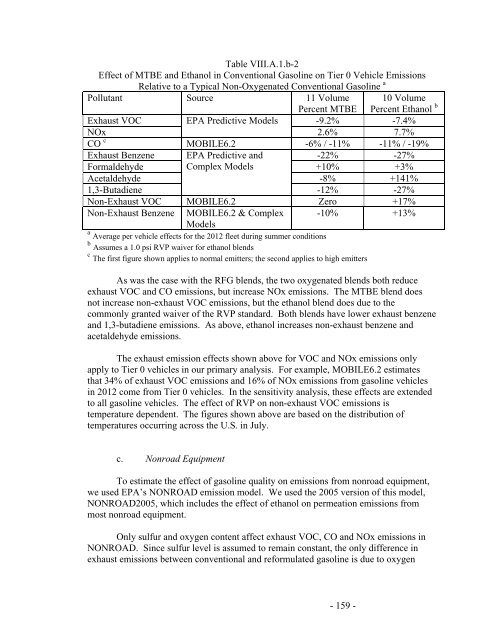
Table VIII.A.1.b-2<br />
Effect <strong>of</strong> MTBE <strong>and</strong> Ethanol in Conventional Gasoline on Tier 0 Vehicle Emissions<br />
Relative to a Typical Non-Oxygenated Conventional Gasoline a<br />
Pollutant Source 11 Volume 10 Volume<br />
Percent MTBE Percent Ethanol b<br />
Exhaust VOC EPA Predictive Models -9.2% -7.4%<br />
NOx<br />
2.6% 7.7%<br />
CO c<br />
MOBILE6.2 -6% / -11% -11% / -19%<br />
Exhaust Benzene EPA Predictive <strong>and</strong><br />
-22% -27%<br />
Formaldehyde Complex Models<br />
+10% +3%<br />
Acetaldehyde -8% +141%<br />
1,3-Butadiene<br />
-12% -27%<br />
Non-Exhaust VOC MOBILE6.2 Zero +17%<br />
Non-Exhaust Benzene MOBILE6.2 & Complex<br />
Models<br />
-10% +13%<br />
a<br />
Average per vehicle effects for the 2012 fleet during summer conditions<br />
b<br />
Assumes a 1.0 psi RVP waiver for ethanol blends<br />
c<br />
The first figure shown applies to normal emitters; the second applies to high emitters<br />
As was the case with the RFG blends, the two oxygenated blends both reduce<br />
exhaust VOC <strong>and</strong> CO emissions, but increase NOx emissions. The MTBE blend does<br />
not increase non-exhaust VOC emissions, but the ethanol blend does due to the<br />
commonly granted waiver <strong>of</strong> the RVP st<strong>and</strong>ard. Both blends have lower exhaust benzene<br />
<strong>and</strong> 1,3-butadiene emissions. As above, ethanol increases non-exhaust benzene <strong>and</strong><br />
acetaldehyde emissions.<br />
The exhaust emission effects shown above for VOC <strong>and</strong> NOx emissions only<br />
apply to Tier 0 vehicles in our primary analysis. For example, MOBILE6.2 estimates<br />
that 34% <strong>of</strong> exhaust VOC emissions <strong>and</strong> 16% <strong>of</strong> NOx emissions from gasoline vehicles<br />
in 2012 come from Tier 0 vehicles. In the sensitivity analysis, these effects are extended<br />
to all gasoline vehicles. The effect <strong>of</strong> RVP on non-exhaust VOC emissions is<br />
temperature dependent. The figures shown above are based on the distribution <strong>of</strong><br />
temperatures occurring across the U.S. in July.<br />
c. Nonroad Equipment<br />
To estimate the effect <strong>of</strong> gasoline quality on emissions from nonroad equipment,<br />
we used EPA’s NONROAD emission model. We used the 2005 version <strong>of</strong> this model,<br />
NONROAD2005, which includes the effect <strong>of</strong> ethanol on permeation emissions from<br />
most nonroad equipment.<br />
Only sulfur <strong>and</strong> oxygen content affect exhaust VOC, CO <strong>and</strong> NOx emissions in<br />
NONROAD. Since sulfur level is assumed to remain constant, the only difference in<br />
exhaust emissions between conventional <strong>and</strong> reformulated gasoline is due to oxygen<br />
- 159 -