Coherent Backscattering from Multiple Scattering Systems - KOPS ...
Coherent Backscattering from Multiple Scattering Systems - KOPS ...
Coherent Backscattering from Multiple Scattering Systems - KOPS ...

Create successful ePaper yourself
Turn your PDF publications into a flip-book with our unique Google optimized e-Paper software.
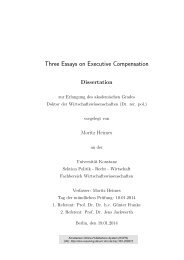
5.2 The coherent backscattering cone in high resolution<br />
1<br />
0.8<br />
l* = 175µm<br />
l* = 180µm<br />
l* = 185µm<br />
l* = 220µm<br />
teflon data<br />
intensity [a.u.]<br />
0.6<br />
0.4<br />
0.2<br />
0<br />
0 0.02 0.04 0.06 0.08 0.1 0.12 0.14 0.16<br />
scattering angle [deg]<br />
Figure 5.13: <strong>Coherent</strong> backscattering cone of teflon. The backscattering data can be<br />
fitted with a cone (i.e. eqn. 2.18) with l ∗ around 180 µm. From eqn. 2.7 one would expect<br />
l ∗ = 220 µm, which is only slightly narrower.<br />
value of l ∗ can then be read <strong>from</strong> the trend of the data, even if these contain some outliers that<br />
could otherwise be quite confusing.<br />
The reason for this tendency to produce unreliable data is that the intensity profile of the<br />
mirror reflex is rendered by extremely few data points. The convolution of mirror profile and<br />
theoretical cone shape, which is used to fit the data, is therefore prone to slight variations<br />
in the slope of the backscattering cone, which result in apparent variations of l ∗ . Although<br />
one instinctively tries to make the focus spot as small as possible to enhance the angular<br />
resolution, it is actually more preferable to go for larger focus spots, which are rendered more<br />
accurately. If the information about the intensity profile of the focus spot is incorporated in<br />
the data evaluation afterwards, this actually does not reduce the angular resolution of the<br />
experiment.<br />
For the teflon sample the data suggest l ∗ ≈ 180 µm, which is consistent with the results<br />
obtained with an older version of the setup [19, 47]. It is also not much lower than the<br />
220 µm that one calculates <strong>from</strong> eqn. 2.7 using the diffusion coefficient D = 16500 m2 /s. An<br />
estimate with D = 27500 m2 /s on the other hand would give a transport mean free path of<br />
about 370 µm, which agrees neither with the old nor the new experimental results. From<br />
the measured transport mean free path one can derive a diffusion coefficient D = 13300 m2 /s,<br />
which is probably the most correct of the three values, although it was not possible to confirm<br />
it in time of flight experiments for technical reasons.<br />
61