Coherent Backscattering from Multiple Scattering Systems - KOPS ...
Coherent Backscattering from Multiple Scattering Systems - KOPS ...
Coherent Backscattering from Multiple Scattering Systems - KOPS ...

Create successful ePaper yourself
Turn your PDF publications into a flip-book with our unique Google optimized e-Paper software.
5 Experiments<br />
1<br />
0.8<br />
data − ( n water<br />
= 1.334 , n particle<br />
= 1.519 ) .<br />
data − ( n water<br />
= 1.334 , n particle<br />
= 1.521 )<br />
data − ( n water<br />
= 1.334 , n particle<br />
= 1.523 )<br />
intensity [a.u.]<br />
0.6<br />
0.4<br />
0.2<br />
0<br />
0 0.05 0.1 0.15 0.2<br />
scattering angle θ ms<br />
[deg]<br />
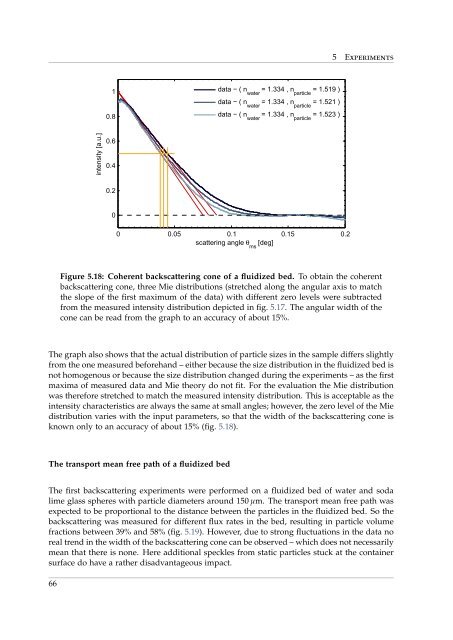
Figure 5.18: <strong>Coherent</strong> backscattering cone of a fluidized bed. To obtain the coherent<br />
backscattering cone, three Mie distributions (stretched along the angular axis to match<br />
the slope of the first maximum of the data) with different zero levels were subtracted<br />
<strong>from</strong> the measured intensity distribution depicted in fig. 5.17. The angular width of the<br />
cone can be read <strong>from</strong> the graph to an accuracy of about 15%.<br />
The graph also shows that the actual distribution of particle sizes in the sample differs slightly<br />
<strong>from</strong> the one measured beforehand – either because the size distribution in the fluidized bed is<br />
not homogenous or because the size distribution changed during the experiments – as the first<br />
maxima of measured data and Mie theory do not fit. For the evaluation the Mie distribution<br />
was therefore stretched to match the measured intensity distribution. This is acceptable as the<br />
intensity characteristics are always the same at small angles; however, the zero level of the Mie<br />
distribution varies with the input parameters, so that the width of the backscattering cone is<br />
known only to an accuracy of about 15% (fig. 5.18).<br />
The transport mean free path of a fluidized bed<br />
The first backscattering experiments were performed on a fluidized bed of water and soda<br />
lime glass spheres with particle diameters around 150 µm. The transport mean free path was<br />
expected to be proportional to the distance between the particles in the fluidized bed. So the<br />
backscattering was measured for different flux rates in the bed, resulting in particle volume<br />
fractions between 39% and 58% (fig. 5.19). However, due to strong fluctuations in the data no<br />
real trend in the width of the backscattering cone can be observed – which does not necessarily<br />
mean that there is none. Here additional speckles <strong>from</strong> static particles stuck at the container<br />
surface do have a rather disadvantageous impact.<br />
66