Coherent Backscattering from Multiple Scattering Systems - KOPS ...
Coherent Backscattering from Multiple Scattering Systems - KOPS ...
Coherent Backscattering from Multiple Scattering Systems - KOPS ...

Create successful ePaper yourself
Turn your PDF publications into a flip-book with our unique Google optimized e-Paper software.
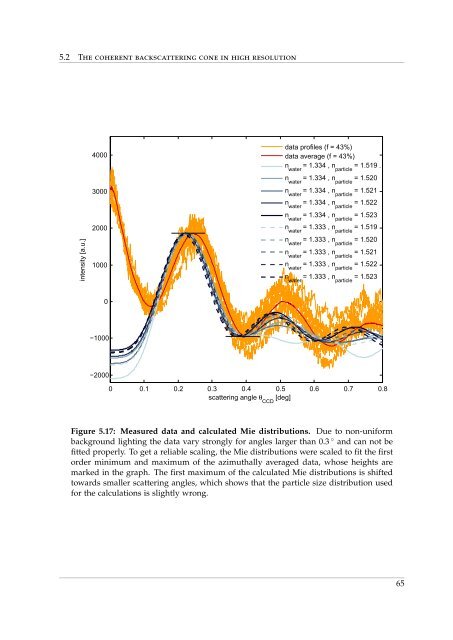
5.2 The coherent backscattering cone in high resolution<br />
intensity [a.u.]<br />
4000<br />
3000<br />
2000<br />
1000<br />
data profiles (f = 43%)<br />
data average (f = 43%)<br />
n water<br />
= 1.334 , n particle<br />
= 1.519 .<br />
n water<br />
= 1.334 , n particle<br />
= 1.520<br />
n water<br />
= 1.334 , n particle<br />
= 1.521<br />
n water<br />
= 1.334 , n particle<br />
= 1.522<br />
n water<br />
= 1.334 , n particle<br />
= 1.523<br />
n water<br />
= 1.333 , n particle<br />
= 1.519<br />
n water<br />
= 1.333 , n particle<br />
= 1.520<br />
n water<br />
= 1.333 , n particle<br />
= 1.521<br />
n water<br />
= 1.333 , n particle<br />
= 1.522<br />
n water<br />
= 1.333 , n particle<br />
= 1.523<br />
0<br />
−1000<br />
−2000<br />
0 0.1 0.2 0.3 0.4 0.5 0.6 0.7 0.8<br />
scattering angle θ CCD<br />
[deg]<br />
Figure 5.17: Measured data and calculated Mie distributions. Due to non-uniform<br />
background lighting the data vary strongly for angles larger than 0.3 ◦ and can not be<br />
fitted properly. To get a reliable scaling, the Mie distributions were scaled to fit the first<br />
order minimum and maximum of the azimuthally averaged data, whose heights are<br />
marked in the graph. The first maximum of the calculated Mie distributions is shifted<br />
towards smaller scattering angles, which shows that the particle size distribution used<br />
for the calculations is slightly wrong.<br />
65