Naylor Road Metro Station Area Access and Capacity - WMATA.com.
Naylor Road Metro Station Area Access and Capacity - WMATA.com.
Naylor Road Metro Station Area Access and Capacity - WMATA.com.

Create successful ePaper yourself
Turn your PDF publications into a flip-book with our unique Google optimized e-Paper software.
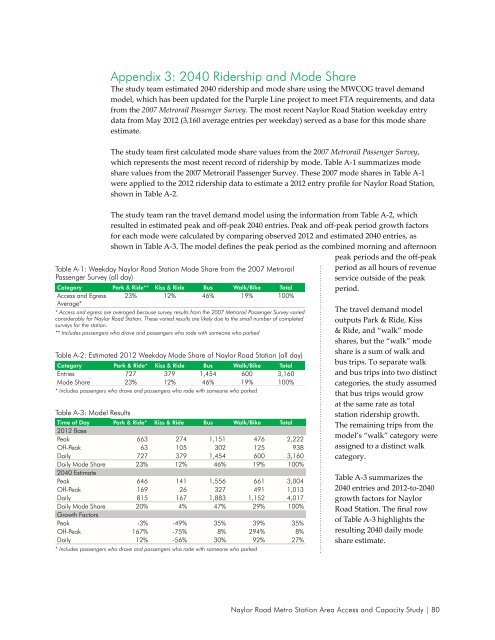
Appendix 3: 2040 Ridership <strong>and</strong> Mode Share<br />
The study team estimated 2040 ridership <strong>and</strong> mode share using the MWCOG travel dem<strong>and</strong><br />
model, which has been updated for the Purple Line project to meet FTA requirements, <strong>and</strong> data<br />
from the 2007 <strong>Metro</strong>rail Passenger Survey. The most recent <strong>Naylor</strong> <strong>Road</strong> <strong>Station</strong> weekday entry<br />
data from May 2012 (3,160 average entries per weekday) served as a base for this mode share<br />
estimate.<br />
The study team first calculated mode share values from the 2007 <strong>Metro</strong>rail Passenger Survey,<br />
which represents the most recent record of ridership by mode. Table A-1 summarizes mode<br />
share values from the 2007 <strong>Metro</strong>rail Passenger Survey. These 2007 mode shares in Table A-1<br />
were applied to the 2012 ridership data to estimate a 2012 entry profile for <strong>Naylor</strong> <strong>Road</strong> <strong>Station</strong>,<br />
shown in Table A-2.<br />
The study team ran the travel dem<strong>and</strong> model using the information from Table A-2, which<br />
resulted in estimated peak <strong>and</strong> off-peak 2040 entries. Peak <strong>and</strong> off-peak period growth factors<br />
for each mode were calculated by <strong>com</strong>paring observed 2012 <strong>and</strong> estimated 2040 entries, as<br />
shown in Table A-3. The model defines the peak period as the <strong>com</strong>bined morning <strong>and</strong> afternoon<br />
peak periods <strong>and</strong> the off-peak<br />
Table A-1: Weekday <strong>Naylor</strong> <strong>Road</strong> <strong>Station</strong> Mode Share from the 2007 <strong>Metro</strong>rail<br />
Passenger Survey (all day)<br />
Category Park & Ride** Kiss & Ride Bus Walk/Bike Total<br />
<strong>Access</strong> <strong>and</strong> Egress 23% 12% 46% 19% 100%<br />
Average*<br />
* <strong>Access</strong> <strong>and</strong> egress are averaged because survey results from the 2007 <strong>Metro</strong>rail Passenger Survey varied<br />
considerably for <strong>Naylor</strong> <strong>Road</strong> <strong>Station</strong>. These varied results are likely due to the small number of <strong>com</strong>pleted<br />
surveys for the station.<br />
** Includes passengers who drove <strong>and</strong> passengers who rode with someone who parked<br />
Table A-2: Estimated 2012 Weekday Mode Share of <strong>Naylor</strong> <strong>Road</strong> <strong>Station</strong> (all day)<br />
Category Park & Ride* Kiss & Ride Bus Walk/Bike Total<br />
Entries 727 379 1,454 600 3,160<br />
Mode Share 23% 12% 46% 19% 100%<br />
* Includes passengers who drove <strong>and</strong> passengers who rode with someone who parked<br />
Table A-3: Model Results<br />
Time of Day Park & Ride* Kiss & Ride Bus Walk/Bike Total<br />
2012 Base<br />
Peak 663 274 1,151 476 2,222<br />
Off-Peak 63 105 302 125 938<br />
Daily 727 379 1,454 600 3,160<br />
Daily Mode Share 23% 12% 46% 19% 100%<br />
2040 Estimate<br />
Peak 646 141 1,556 661 3,004<br />
Off-Peak 169 26 327 491 1,013<br />
Daily 815 167 1,883 1,152 4,017<br />
Daily Mode Share 20% 4% 47% 29% 100%<br />
Growth Factors<br />
Peak -3% -49% 35% 39% 35%<br />
Off-Peak 167% -75% 8% 294% 8%<br />
Daily 12% -56% 30% 92% 27%<br />
* Includes passengers who drove <strong>and</strong> passengers who rode with someone who parked<br />
period as all hours of revenue<br />
service outside of the peak<br />
period.<br />
The travel dem<strong>and</strong> model<br />
outputs Park & Ride, Kiss<br />
& Ride, <strong>and</strong> “walk” mode<br />
shares, but the “walk” mode<br />
share is a sum of walk <strong>and</strong><br />
bus trips. To separate walk<br />
<strong>and</strong> bus trips into two distinct<br />
categories, the study assumed<br />
that bus trips would grow<br />
at the same rate as total<br />
station ridership growth.<br />
The remaining trips from the<br />
model’s “walk” category were<br />
assigned to a distinct walk<br />
category.<br />
Table A-3 summarizes the<br />
2040 entries <strong>and</strong> 2012-to-2040<br />
growth factors for <strong>Naylor</strong><br />
<strong>Road</strong> <strong>Station</strong>. The final row<br />
of Table A-3 highlights the<br />
resulting 2040 daily mode<br />
share estimate.<br />
<strong>Naylor</strong> <strong>Road</strong> <strong>Metro</strong> <strong>Station</strong> <strong>Area</strong> <strong>Access</strong> <strong>and</strong> <strong>Capacity</strong> Study | 80