Naylor Road Metro Station Area Access and Capacity - WMATA.com.
Naylor Road Metro Station Area Access and Capacity - WMATA.com.
Naylor Road Metro Station Area Access and Capacity - WMATA.com.

Create successful ePaper yourself
Turn your PDF publications into a flip-book with our unique Google optimized e-Paper software.
estimates a 35-percent increase in peak period <strong>Metro</strong>rail entries <strong>and</strong> an eight-percent increase in<br />
off-peak entries between 2012 <strong>and</strong> 2040, resulting in a total daily increase of 27 percent. Most of<br />
the growth in <strong>Naylor</strong> <strong>Road</strong> <strong>Station</strong> entries is concentrated in the peak period. This is consistent<br />
with the redevelopment vision for the station area that emphasizes high-density office in the<br />
immediate <strong>Naylor</strong> <strong>Road</strong> <strong>Station</strong> area, which will increase peak-period <strong>com</strong>muting.<br />
<strong>Station</strong> <strong>Access</strong><br />
With the transformation of the <strong>Naylor</strong> <strong>Road</strong> <strong>Station</strong> area from an automobile-oriented transit<br />
center to a regional center of mixed-use TOD, how people access the station will change by 2040.<br />
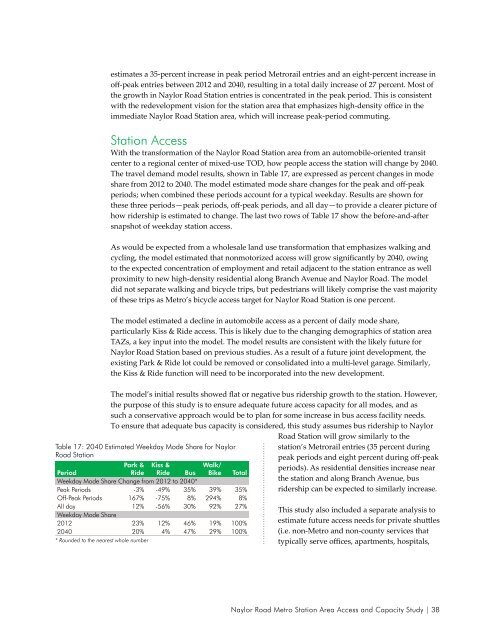
The travel dem<strong>and</strong> model results, shown in Table 17, are expressed as percent changes in mode<br />
share from 2012 to 2040. The model estimated mode share changes for the peak <strong>and</strong> off-peak<br />
periods; when <strong>com</strong>bined these periods account for a typical weekday. Results are shown for<br />
these three periods—peak periods, off-peak periods, <strong>and</strong> all day—to provide a clearer picture of<br />
how ridership is estimated to change. The last two rows of Table 17 show the before-<strong>and</strong>-after<br />
snapshot of weekday station access.<br />
As would be expected from a wholesale l<strong>and</strong> use transformation that emphasizes walking <strong>and</strong><br />
cycling, the model estimated that nonmotorized access will grow significantly by 2040, owing<br />
to the expected concentration of employment <strong>and</strong> retail adjacent to the station entrance as well<br />
proximity to new high-density residential along Branch Avenue <strong>and</strong> <strong>Naylor</strong> <strong>Road</strong>. The model<br />
did not separate walking <strong>and</strong> bicycle trips, but pedestrians will likely <strong>com</strong>prise the vast majority<br />
of these trips as <strong>Metro</strong>’s bicycle access target for <strong>Naylor</strong> <strong>Road</strong> <strong>Station</strong> is one percent.<br />
The model estimated a decline in automobile access as a percent of daily mode share,<br />
particularly Kiss & Ride access. This is likely due to the changing demographics of station area<br />
TAZs, a key input into the model. The model results are consistent with the likely future for<br />
<strong>Naylor</strong> <strong>Road</strong> <strong>Station</strong> based on previous studies. As a result of a future joint development, the<br />
existing Park & Ride lot could be removed or consolidated into a multi-level garage. Similarly,<br />
the Kiss & Ride function will need to be incorporated into the new development.<br />
The model’s initial results showed flat or negative bus ridership growth to the station. However,<br />
the purpose of this study is to ensure adequate future access capacity for all modes, <strong>and</strong> as<br />
such a conservative approach would be to plan for some increase in bus access facility needs.<br />
To ensure that adequate bus capacity is considered, this study assumes bus ridership to <strong>Naylor</strong><br />
Table 17: 2040 Estimated Weekday Mode Share for <strong>Naylor</strong><br />
<strong>Road</strong> <strong>Station</strong><br />
Period<br />
Park &<br />
Ride<br />
Kiss &<br />
Ride Bus<br />
Walk/<br />
Bike Total<br />
Weekday Mode Share Change from 2012 to 2040*<br />
Peak Periods -3% -49% 35% 39% 35%<br />
Off-Peak Periods 167% -75% 8% 294% 8%<br />
All day 12% -56% 30% 92% 27%<br />
Weekday Mode Share<br />
2012 23% 12% 46% 19% 100%<br />
2040 20% 4% 47% 29% 100%<br />
* Rounded to the nearest whole number<br />
<strong>Road</strong> <strong>Station</strong> will grow similarly to the<br />
station’s <strong>Metro</strong>rail entries (35 percent during<br />
peak periods <strong>and</strong> eight percent during off-peak<br />
periods). As residential densities increase near<br />
the station <strong>and</strong> along Branch Avenue, bus<br />
ridership can be expected to similarly increase.<br />
This study also included a separate analysis to<br />
estimate future access needs for private shuttles<br />
(i.e. non-<strong>Metro</strong> <strong>and</strong> non-county services that<br />
typically serve offices, apartments, hospitals,<br />
<strong>Naylor</strong> <strong>Road</strong> <strong>Metro</strong> <strong>Station</strong> <strong>Area</strong> <strong>Access</strong> <strong>and</strong> <strong>Capacity</strong> Study | 38