Naylor Road Metro Station Area Access and Capacity - WMATA.com.
Naylor Road Metro Station Area Access and Capacity - WMATA.com.
Naylor Road Metro Station Area Access and Capacity - WMATA.com.

You also want an ePaper? Increase the reach of your titles
YUMPU automatically turns print PDFs into web optimized ePapers that Google loves.
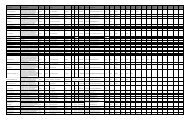
Crash data, summarized in Table 9 <strong>and</strong> provided by SHA<br />
as recorded by police reports, reveals that Branch Avenue<br />
experiences more collisions than <strong>Naylor</strong> <strong>Road</strong>.<br />
While some of these collisions may be attributed higher<br />
traffic volumes on Branch Avenue, the crash rate (i.e.<br />
typically the number of crashes per million or 100 million<br />
vehicle miles traveled, or VMT) appears <strong>com</strong>paratively high<br />
to <strong>Naylor</strong> <strong>Road</strong>. For year 2008—the only year available for<br />
<strong>com</strong>parison as AADT data is from 2008 to 2010 <strong>and</strong> crash<br />
data is from 2006 to 2008—Branch Avenue’s total crash rate<br />
(420 crashes per 100 million VMT) is more than two times<br />
<strong>Naylor</strong> <strong>Road</strong>’s rate (201 crashes per 100 million VMT), as<br />
Table 9: Crash Data<br />
Crash Type 2006 2007 2008 Total<br />
Branch Avenue (Curtis Drive to Suitl<strong>and</strong> Parkway)<br />
Fatal 0 0 0 0<br />
Injury 21 19 20 60<br />
Property 19 33 15 67<br />
Total 40 52 35 127<br />
<strong>Naylor</strong> <strong>Road</strong> (<strong>Metro</strong>rail tracks to Branch Avenue)<br />
Fatal 0 0 0 0<br />
Injury 3 3 4 10<br />
Property 6 4 2 12<br />
Total 9 7 6 22<br />
Source: SHA<br />
calculated using the Federal Highway Administration’s (FHWA) formula (Appendix 9). Total<br />
collisions dropped on Branch Avenue <strong>and</strong> <strong>Naylor</strong> <strong>Road</strong> between 2006 <strong>and</strong> 2008, though Branch<br />
Avenue property crashes increased greatly in 2007 before dropping in 2008. In contrast to SHA<br />
ranking Prince George’s County first in Maryl<strong>and</strong> in 2008 traffic fatalities, no roadway fatalities<br />
occurred between 2006 <strong>and</strong> 2008 near <strong>Naylor</strong> <strong>Road</strong> <strong>Station</strong>.<br />
Kiss & Ride<br />
The <strong>Naylor</strong> <strong>Road</strong> <strong>Station</strong> Kiss & Ride lot includes a taxi st<strong>and</strong>, 13 A-spaces (15-minute<br />
temporary parking at all times), 42 short-term metered spaces (free 15-minute parking during<br />
peak periods), four Zipcar spaces, four h<strong>and</strong>icap spaces, <strong>and</strong> 10 motorcycle spaces. During<br />
the afternoon peak period, when the greatest incidence of motorists waiting to pick up rail<br />
passengers typically takes place, 55 temporary parking spaces are available (13 A-spaces <strong>and</strong> 42<br />
short-term metered spaces). H<strong>and</strong>icap, motorcycle, <strong>and</strong> Zipcar spaces, as well as the taxi st<strong>and</strong>,<br />
are omitted from any analysis of Kiss & Ride capacity, as they are not available to most motorists<br />
picking up passengers.<br />
Field observations conducted during the afternoon peak period at <strong>Naylor</strong> <strong>Road</strong> <strong>Station</strong> in<br />
August 2011 showed that the average dwell time for vehicles in the Kiss & Ride is approximately<br />
2.7 minutes. Rounding this figure up to three minutes <strong>and</strong> adding a 30-second buffer between<br />
vehicles using the same space yields a capacity of one vehicle per space every 3.5 minutes, or 17<br />
vehicles per hour for each space. Factored by the 55 available spaces, that results in an overall<br />
Kiss & Ride capacity of approximately 935 vehicles per hour. Considering that the station<br />
ridership estimates that the maximum daily Kiss & Ride pickups are approximately 505 (see<br />
Table 4), there is ample capacity to ac<strong>com</strong>modate all users in the Kiss & Ride lot (Figure 32).<br />
Even if all 505 maximum daily pickups occurred in a single hour, the <strong>Naylor</strong> <strong>Road</strong> Kiss & Ride<br />
would only require approximately 30 temporary parking spaces to ac<strong>com</strong>modate dem<strong>and</strong>.<br />
Nevertheless, during field observations congestion was observed to be a problem. The<br />
congestion stemmed from motorists waiting for passengers in areas other than marked spaces,<br />
which illustrates that may people picking up passengers prefer to queue rather than pull into<br />
a parking space. This problem is particularly acute in the curved lane immediately adjacent to<br />
the crosswalk closest to the station entrance (Figure 33). Congestion in this spot is particularly<br />
problematic as it can back up to the entrance of the Kiss & Ride lot.<br />
27 | Existing <strong>Station</strong> <strong>Area</strong> Characteristics