Naylor Road Metro Station Area Access and Capacity - WMATA.com.
Naylor Road Metro Station Area Access and Capacity - WMATA.com.
Naylor Road Metro Station Area Access and Capacity - WMATA.com.

Create successful ePaper yourself
Turn your PDF publications into a flip-book with our unique Google optimized e-Paper software.
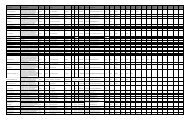
Appendix 4: Bus Bay Requirements<br />
Determining the number of bus bays required to ac<strong>com</strong>modate future service began with a<br />
calculation of existing utilization rates for each bus bay. Table A-4 shows the calculation of bus<br />
bay requirements by route, <strong>and</strong> Table A-5 shows the rate of utilization by bus bay. Existing peak<br />
hour headways <strong>and</strong> recovery times were derived from data provided by <strong>Metro</strong> <strong>and</strong> TheBus. All<br />
routes include a minimum dwell time of one minute, <strong>and</strong> any scheduled dwell time over one<br />
minute was entered as recovery time.<br />
To estimate at the number of buses that will serve <strong>Naylor</strong> <strong>Road</strong> <strong>Station</strong> during the peak hour in<br />
2040—<strong>and</strong> thus the required number of bus bays—the analysis used the passenger load metric<br />
(see Table A-6), which is equal to the occupancy of the bus at the station. Because the passenger<br />
load includes riders passing through a point as well as those exiting or entering at a point, it<br />
provides a more <strong>com</strong>plete picture of dem<strong>and</strong> for bus service.<br />
The analysis assumed<br />
that the passenger<br />
loads for all routes<br />
that serve at <strong>Naylor</strong><br />
<strong>Road</strong> <strong>Station</strong> are<br />
approximately 35<br />
passengers per<br />
bus. These per-bus<br />
passenger loads<br />
were multiplied by<br />
the number of buses<br />
that serve the station<br />
during the peak<br />
hour (Table A-4), <strong>and</strong><br />
then multiplied by<br />
the percent increase<br />
in peak-period bus<br />
passengers estimated<br />
from the travel dem<strong>and</strong> model. The<br />
result, shown in Table A-6, is a routeby-route<br />
estimate of average peak hour<br />
passenger loads at <strong>Naylor</strong> <strong>Road</strong> <strong>Station</strong><br />
by 2040.<br />
Table A-7 summarizes the estimate of<br />
required <strong>Naylor</strong> <strong>Road</strong> <strong>Station</strong> bus bays<br />
per route by 2040. The number of buses<br />
per peak hour by 2040 is calculated<br />
by dividing the 2040 average peak<br />
hour passenger load by the assumed<br />
capacity of a typical bus, in this case<br />
Table A-4: Existing Bus Bays Required<br />
(A) Peak<br />
Hour<br />
Headway<br />
(minutes)<br />
(B) Buses per<br />
Peak Hour<br />
(C) Average<br />
Recovery<br />
Time<br />
(minutes)<br />
(D) Average<br />
Total Time at<br />
Bay per Bus<br />
(minutes)<br />
(E) Tolerance<br />
Time<br />
(minutes)<br />
(F) Bays<br />
Required<br />
Route<br />
<strong>Metro</strong>bus<br />
M2 20 3.0 3 4 4 0.4<br />
F14 30 2.0 5 6 4 0.3<br />
H11/12/13 15 4.0 6 7 4 0.7<br />
C12/C14 25 2.4 4 5 4 0.4<br />
36 15 4.0 9 10 4 0.9<br />
39 15 4.0 0 1 4 0.3<br />
34 15 4.0 5 6 4 0.7<br />
TheBus<br />
32 30 2.0 8 9 4 0.4<br />
Total 25.0 6.0<br />
D. Average Total Time at Bay per Bus = One-minute dwell time + C<br />
E. Tolerance Time = Accounts for the variation of arrival times (two minutes for through buses <strong>and</strong><br />
four minutes for terminating buses)<br />
F. Bays Required = ((D + E) * B) / 60<br />
Table A-5: Existing Bus Bay Utilization<br />
Bus<br />
Bay<br />
(G) Buses<br />
per Peak<br />
Hour<br />
(H) Total<br />
Time at Bay<br />
(minutes)<br />
(I) Bay<br />
Utilization<br />
Route<br />
Provider<br />
M2 <strong>Metro</strong>bus A 3 24 40%<br />
F14 <strong>Metro</strong>bus B 2 20 33%<br />
Drop off only - C - - -<br />
H11/12/13 <strong>Metro</strong>bus D 4 44 73%<br />
C12/C14 <strong>Metro</strong>bus E 2.4 22 36%<br />
36, 39 <strong>Metro</strong>bus F 8 76 127%<br />
34 <strong>Metro</strong>bus G 4 40 67%<br />
32 TheBus H 2 26 43%<br />
G. Buses per Peak Hour = ∑ B per bay<br />
H. Total Time at Bay = ∑ (B * (D + E)) per bay<br />
I. Bay Utilization = H / 60<br />
81 | Appendices