

Targets IMage Energy Regional (TIMER) Model, Technical ...
Targets IMage Energy Regional (TIMER) Model, Technical ...
Targets IMage Energy Regional (TIMER) Model, Technical ...

You also want an ePaper? Increase the reach of your titles
YUMPU automatically turns print PDFs into web optimized ePapers that Google loves.
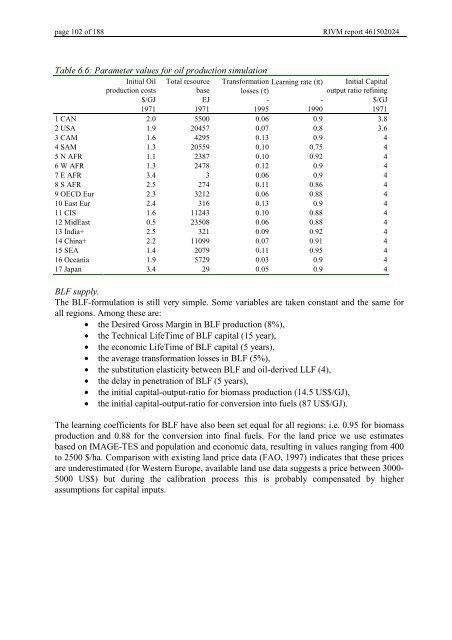
page 102 of 188 RIVM report 461502024<br />
7DEOH3DUDPHWHUYDOXHVIRURLOSURGXFWLRQVLPXODWLRQ<br />
Initial Oil Total resource Transformation Learning rate (π) Initial Capital<br />
production costs<br />
base losses (τ)<br />
output ratio refining<br />
$/GJ EJ - - $/GJ<br />
1971 1971 1995 1990 1971<br />
1 CAN 2.0 5500 0.06 0.9 3.8<br />
2 USA 1.9 20457 0.07 0.8 3.6<br />
3 CAM 1.6 4295 0.13 0.9 4<br />
4 SAM 1.3 20559 0.10 0.75 4<br />
5 N AFR 1.1 2387 0.10 0.92 4<br />
6 W AFR 1.3 2478 0.12 0.9 4<br />
7 E AFR 3.4 3 0.06 0.9 4<br />
8 S AFR 2.5 274 0.11 0.86 4<br />
9 OECD Eur 2.3 3212 0.06 0.88 4<br />
10 East Eur 2.4 316 0.13 0.9 4<br />
11 CIS 1.6 11243 0.10 0.88 4<br />
12 MidEast 0.5 23508 0.06 0.88 4<br />
13 India+ 2.5 321 0.09 0.92 4<br />
14 China+ 2.2 11099 0.07 0.91 4<br />
15 SEA 1.4 2079 0.11 0.95 4<br />
16 Oceania 1.9 5729 0.03 0.9 4<br />
17 Japan 3.4 29 0.05 0.9 4<br />
%/)VXSSO\<br />
The BLF-formulation is still very simple. Some variables are taken constant and the same for<br />
all regions. Among these are:<br />
• the Desired Gross Margin in BLF production (8%),<br />
• the <strong>Technical</strong> LifeTime of BLF capital (15 year),<br />
• the economic LifeTime of BLF capital (5 years),<br />
• the average transformation losses in BLF (5%),<br />
• the substitution elasticity between BLF and oil-derived LLF (4),<br />
• the delay in penetration of BLF (5 years),<br />
• the initial capital-output-ratio for biomass production (14.5 US$/GJ),<br />
• the initial capital-output-ratio for conversion into fuels (87 US$/GJ).<br />
The learning coefficients for BLF have also been set equal for all regions: i.e. 0.95 for biomass<br />
production and 0.88 for the conversion into final fuels. For the land price we use estimates<br />
based on IMAGE-TES and population and economic data, resulting in values ranging from 400<br />
to 2500 $/ha. Comparison with existing land price data (FAO, 1997) indicates that these prices<br />
are underestimated (for Western Europe, available land use data suggests a price between 3000-<br />
5000 US$) but during the calibration process this is probably compensated by higher<br />
assumptions for capital inputs.


