

Targets IMage Energy Regional (TIMER) Model, Technical ...
Targets IMage Energy Regional (TIMER) Model, Technical ...
Targets IMage Energy Regional (TIMER) Model, Technical ...

Create successful ePaper yourself
Turn your PDF publications into a flip-book with our unique Google optimized e-Paper software.
RIVM report 461502024 page 47 of 188<br />
attribution to AEEI instead of PIEEI is somewhat ambiguous, as has been discussed before.<br />
Certainly in this case, the AEEI has been so effective because the oil crises of the 1970s and<br />
1980s initiated a consumer demand for more fuel-efficient cars and wave of innovations with<br />
manufacturers. Thus, it was actually a price-induced response, one could argue. Also fuel<br />
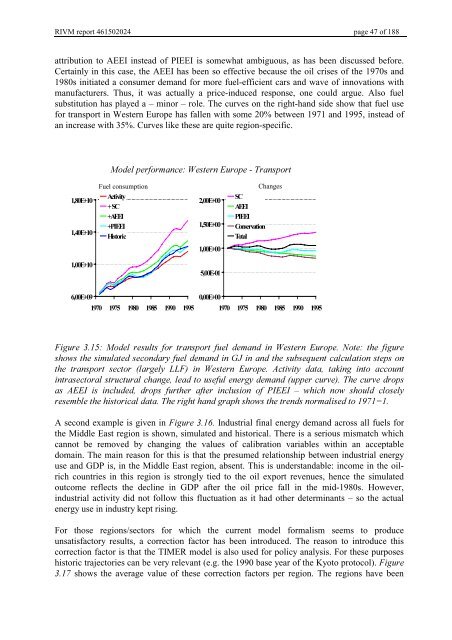
substitution has played a – minor – role. The curves on the right-hand side show that fuel use<br />
for transport in Western Europe has fallen with some 20% between 1971 and 1995, instead of<br />
an increase with 35%. Curves like these are quite region-specific.<br />
0RGHOSHUIRUPDQFH:HVWHUQ(XURSH7UDQVSRUW<br />
Changes<br />
(<br />
(<br />
Fuel consumption<br />
$FWLYLW\<br />
6&<br />
$((,<br />
3,((,<br />
+LVWRULF<br />
(<br />
(<br />
6&<br />
$((,<br />
3,((,<br />
&RQVHUYDWLRQ<br />
7RWDO<br />
(<br />
(<br />
(<br />
(<br />
<br />
(<br />
<br />
)LJXUH 0RGHO UHVXOWV IRU WUDQVSRUW IXHO GHPDQG LQ :HVWHUQ (XURSH 1RWH WKH ILJXUH<br />
VKRZVWKHVLPXODWHGVHFRQGDU\IXHOGHPDQGLQ*-LQDQGWKHVXEVHTXHQWFDOFXODWLRQVWHSVRQ<br />
WKH WUDQVSRUW VHFWRU ODUJHO\ //) LQ :HVWHUQ (XURSH $FWLYLW\ GDWD WDNLQJ LQWR DFFRXQW<br />
LQWUDVHFWRUDOVWUXFWXUDOFKDQJHOHDGWRXVHIXOHQHUJ\GHPDQGXSSHUFXUYH7KHFXUYHGURSV<br />
DV $((, LV LQFOXGHG GURSV IXUWKHU DIWHU LQFOXVLRQ RI 3,((, ± ZKLFK QRZ VKRXOG FORVHO\<br />
UHVHPEOHWKHKLVWRULFDOGDWD7KHULJKWKDQGJUDSKVKRZVWKHWUHQGVQRUPDOLVHGWR <br />
A second example is given in )LJXUH Industrial final energy demand across all fuels for<br />
the Middle East region is shown, simulated and historical. There is a serious mismatch which<br />
cannot be removed by changing the values of calibration variables within an acceptable<br />
domain. The main reason for this is that the presumed relationship between industrial energy<br />
use and GDP is, in the Middle East region, absent. This is understandable: income in the oilrich<br />
countries in this region is strongly tied to the oil export revenues, hence the simulated<br />
outcome reflects the decline in GDP after the oil price fall in the mid-1980s. However,<br />
industrial activity did not follow this fluctuation as it had other determinants – so the actual<br />
energy use in industry kept rising.<br />
For those regions/sectors for which the current model formalism seems to produce<br />
unsatisfactory results, a correction factor has been introduced. The reason to introduce this<br />
correction factor is that the <strong>TIMER</strong> model is also used for policy analysis. For these purposes<br />
historic trajectories can be very relevant (e.g. the 1990 base year of the Kyoto protocol). )LJXUH<br />
shows the average value of these correction factors per region. The regions have been


