

Targets IMage Energy Regional (TIMER) Model, Technical ...
Targets IMage Energy Regional (TIMER) Model, Technical ...
Targets IMage Energy Regional (TIMER) Model, Technical ...

You also want an ePaper? Increase the reach of your titles
YUMPU automatically turns print PDFs into web optimized ePapers that Google loves.
page 26 of 188 RIVM report 461502024<br />
machines etc. In the next stage, often less energy-intensive activities start to dominate sectoral<br />
energy consumption at the margin. As a result, the activities within the sector grow faster than<br />
energy use, and thus intensity declines. There are still large uncertainties about what actually<br />
happens and further research is needed.<br />
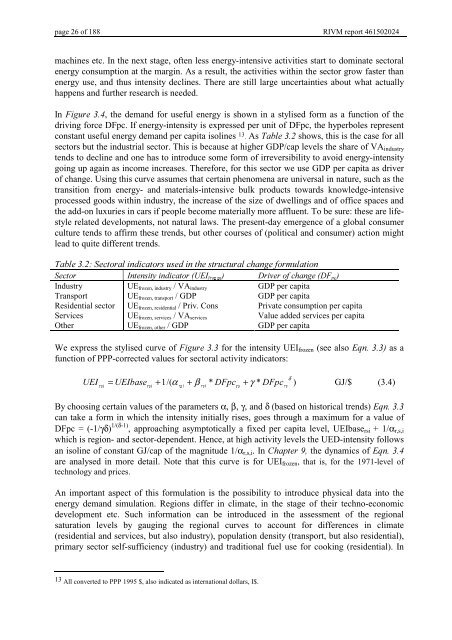
In )LJXUH, the demand for useful energy is shown in a stylised form as a function of the<br />
driving force DFpc. If energy-intensity is expressed per unit of DFpc, the hyperboles represent<br />
constant useful energy demand per capita isolines 13 . As 7DEOH shows, this is the case for all<br />
sectors but the industrial sector. This is because at higher GDP/cap levels the share of VA industry<br />
tends to decline and one has to introduce some form of irreversibility to avoid energy-intensity<br />
going up again as income increases. Therefore, for this sector we use GDP per capita as driver<br />
of change. Using this curve assumes that certain phenomena are universal in nature, such as the<br />
transition from energy- and materials-intensive bulk products towards knowledge-intensive<br />
processed goods within industry, the increase of the size of dwellings and of office spaces and<br />
the add-on luxuries in cars if people become materially more affluent. To be sure: these are lifestyle<br />
related developments, not natural laws. The present-day emergence of a global consumer<br />
culture tends to affirm these trends, but other courses of (political and consumer) action might<br />
lead to quite different trends.<br />
7DEOH6HFWRUDOLQGLFDWRUVXVHGLQWKHVWUXFWXUDOFKDQJHIRUPXODWLRQ<br />
6HFWRU ,QWHQVLW\LQGLFDWRU8(, IUR]HQ 'ULYHURIFKDQJH') SF <br />
Industry<br />
Transport<br />
Residential sector<br />
Services<br />
Other<br />
UE frozen, industry / VA industry<br />
UE frozen, transport / GDP<br />
UE frozen, residential / Priv. Cons<br />
UE frozen, services / VA services<br />
UE frozen, other / GDP<br />
GDP per capita<br />
GDP per capita<br />
Private consumption per capita<br />
Value added services per capita<br />
GDP per capita<br />
We express the stylised curve of )LJXUH for the intensity UEI frozen (see also (TQas a<br />
function of PPP-corrected values for sectoral activity indicators:<br />
8(, = 8(,EDVH + 1/( α + β * ')SF + γ * ')SF ) GJ/$ (3.4)<br />
UVL<br />
UVL<br />
UVL<br />
UVL<br />
By choosing certain values of the parameters α, β, γ, and δ (based on historical trends) (TQ<br />
can take a form in which the intensity initially rises, goes through a maximum for a value of<br />
DFpc = (-1/γδ) 1/(δ-1) , approaching asymptotically a fixed per capita level, UEIbase rsi + 1/α r,s,i<br />
which is region- and sector-dependent. Hence, at high activity levels the UED-intensity follows<br />
an isoline of constant GJ/cap of the magnitude 1/α r,s,i . In &KDSWHUthe dynamics of (TQ<br />
are analysed in more detail. Note that this curve is for UEI frozen , that is, for the 1971-level of<br />
technology and prices.<br />
An important aspect of this formulation is the possibility to introduce physical data into the<br />
energy demand simulation. Regions differ in climate, in the stage of their techno-economic<br />
development etc. Such information can be introduced in the assessment of the regional<br />
saturation levels by gauging the regional curves to account for differences in climate<br />
(residential and services, but also industry), population density (transport, but also residential),<br />
primary sector self-sufficiency (industry) and traditional fuel use for cooking (residential). In<br />
UV<br />
UV<br />
δ<br />
13 All converted to PPP 1995 $, also indicated as international dollars, I$.


