Targets IMage Energy Regional (TIMER) Model, Technical ...
Targets IMage Energy Regional (TIMER) Model, Technical ...
Targets IMage Energy Regional (TIMER) Model, Technical ...
You also want an ePaper? Increase the reach of your titles
YUMPU automatically turns print PDFs into web optimized ePapers that Google loves.
page 30 of 188 RIVM report 461502024<br />
determined either by an exogenous time-series of annual decline percentages or, as part of a<br />
learning-by-doing process, related to the cumulated conservation investments. Note that 0 <<br />
EEopt < CC max and that EEopt is the factor with which UED is to be multiplied to get the<br />
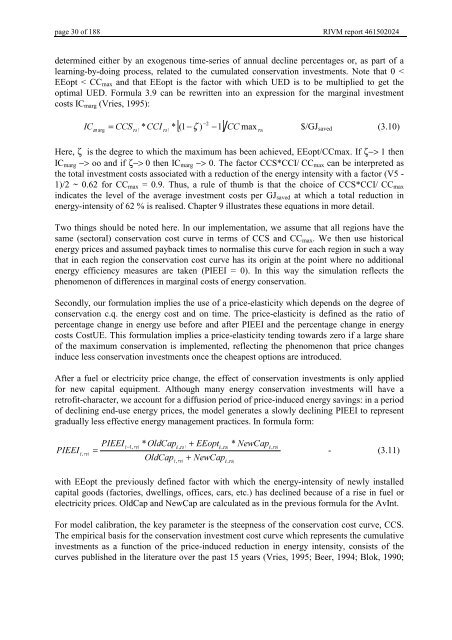
optimal UED. Formula 3.9 can be rewritten into an expression for the marginal investment<br />
costs IC marg (Vries, 1995):<br />
,&<br />
P arg<br />
= &&6<br />
UVL<br />
*&&,<br />
UVL<br />
*<br />
−2<br />
[(1<br />
− ) −1] && max<br />
UVL<br />
ζ $/GJ saved (3.10)<br />
Here, ζ is the degree to which the maximum has been achieved, EEopt/CCmax. If ζ−> 1 then<br />
IC marg −> oo and if ζ−> 0 then IC marg −> 0. The factor CCS*CCI/ CC max can be interpreted as<br />
the total investment costs associated with a reduction of the energy intensity with a factor (V5 -<br />
1)/2 ~ 0.62 for CC max = 0.9. Thus, a rule of thumb is that the choice of CCS*CCI/ CC max<br />
indicates the level of the average investment costs per GJ saved at which a total reduction in<br />
energy-intensity of 62 % is realised. Chapter 9 illustrates these equations in more detail.<br />
Two things should be noted here. In our implementation, we assume that all regions have the<br />
same (sectoral) conservation cost curve in terms of CCS and CC max . We then use historical<br />
energy prices and assumed payback times to normalise this curve for each region in such a way<br />
that in each region the conservation cost curve has its origin at the point where no additional<br />
energy efficiency measures are taken (PIEEI = 0). In this way the simulation reflects the<br />
phenomenon of differences in marginal costs of energy conservation.<br />
Secondly, our formulation implies the use of a price-elasticity which depends on the degree of<br />
conservation c.q. the energy cost and on time. The price-elasticity is defined as the ratio of<br />
percentage change in energy use before and after PIEEI and the percentage change in energy<br />
costs CostUE. This formulation implies a price-elasticity tending towards zero if a large share<br />
of the maximum conservation is implemented, reflecting the phenomenon that price changes<br />
induce less conservation investments once the cheapest options are introduced.<br />
After a fuel or electricity price change, the effect of conservation investments is only applied<br />
for new capital equipment. Although many energy conservation investments will have a<br />
retrofit-character, we account for a diffusion period of price-induced energy savings: in a period<br />
of declining end-use energy prices, the model generates a slowly declining PIEEI to represent<br />
gradually less effective energy management practices. In formula form:<br />
3,((,<br />
,<br />
W UVL<br />
=<br />
3,((,<br />
−1,<br />
W<br />
UVL<br />
* 2OG&DS<br />
2OG&DS<br />
W UVL<br />
,<br />
,<br />
W UVL<br />
+ ((RSW<br />
W UVL<br />
+ 1HZ&DS<br />
,<br />
,<br />
* 1HZ&DS<br />
W UVL<br />
,<br />
W UVL<br />
- (3.11)<br />
with EEopt the previously defined factor with which the energy-intensity of newly installed<br />
capital goods (factories, dwellings, offices, cars, etc.) has declined because of a rise in fuel or<br />
electricity prices. OldCap and NewCap are calculated as in the previous formula for the AvInt.<br />
For model calibration, the key parameter is the steepness of the conservation cost curve, CCS.<br />
The empirical basis for the conservation investment cost curve which represents the cumulative<br />
investments as a function of the price-induced reduction in energy intensity, consists of the<br />
curves published in the literature over the past 15 years (Vries, 1995; Beer, 1994; Blok, 1990;


