Targets IMage Energy Regional (TIMER) Model, Technical ...
Targets IMage Energy Regional (TIMER) Model, Technical ...
Targets IMage Energy Regional (TIMER) Model, Technical ...
You also want an ePaper? Increase the reach of your titles
YUMPU automatically turns print PDFs into web optimized ePapers that Google loves.
RIVM report 461502024 page 65 of 188<br />
)XHOEDVHGWKHUPDO7SRZHUJHQHUDWLRQ<br />
The simulation of T-production hinges on several region-dependent variables:<br />
• the fraction of demand which is considered base-load, FracBL (see earlier in this<br />
paragraph);<br />
• the maximum load factor for peak-load capacity, PLF max ;<br />
• the time-dependent load factor for base-load T capacity, BLF T ;<br />
• the time-dependent efficiencies of thermal plants (per fuel type) (η);<br />
• the time-dependent investments costs of thermal plants (Isp T );<br />
• the time-dependent fuels costs (as calculated in other submodels of <strong>TIMER</strong>);<br />
• the time-dependent premium values (PT);<br />
Using historical time-series for T-capacity and T-generation, we have varied the first two<br />
variables in such a way that simulated and historical data give a good match. If this did not<br />
succeed with a constant BLF T , its value has been adjusted. This procedure turned out to be<br />
fairly straightforward.<br />
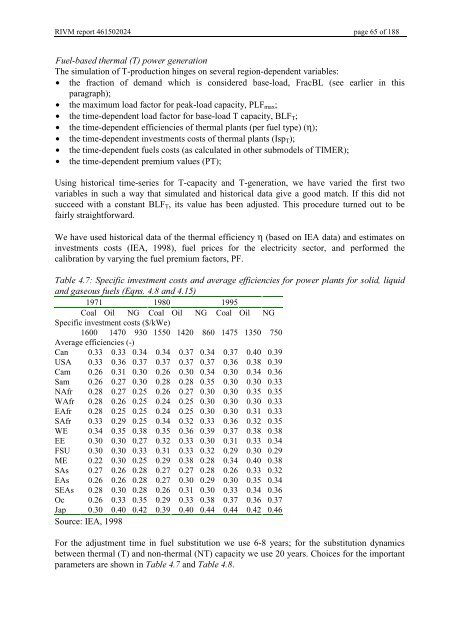
We have used historical data of the thermal efficiency η (based on IEA data) and estimates on<br />
investments costs (IEA, 1998), fuel prices for the electricity sector, and performed the<br />
calibration by varying the fuel premium factors, PF.<br />
7DEOH6SHFLILFLQYHVWPHQWFRVWVDQGDYHUDJHHIILFLHQFLHVIRUSRZHUSODQWVIRUVROLGOLTXLG<br />
DQGJDVHRXVIXHOV(TQVDQG<br />
1971 1980 1995<br />
Coal Oil NG Coal Oil NG Coal Oil NG<br />
Specific investment costs ($/kWe)<br />
1600 1470 930 1550 1420 860 1475 1350 750<br />
Average efficiencies (-)<br />
Can 0.33 0.33 0.34 0.34 0.37 0.34 0.37 0.40 0.39<br />
USA 0.33 0.36 0.37 0.37 0.37 0.37 0.36 0.38 0.39<br />
Cam 0.26 0.31 0.30 0.26 0.30 0.34 0.30 0.34 0.36<br />
Sam 0.26 0.27 0.30 0.28 0.28 0.35 0.30 0.30 0.33<br />
NAfr 0.28 0.27 0.25 0.26 0.27 0.30 0.30 0.35 0.35<br />
WAfr 0.28 0.26 0.25 0.24 0.25 0.30 0.30 0.30 0.33<br />
EAfr 0.28 0.25 0.25 0.24 0.25 0.30 0.30 0.31 0.33<br />
SAfr 0.33 0.29 0.25 0.34 0.32 0.33 0.36 0.32 0.35<br />
WE 0.34 0.35 0.38 0.35 0.36 0.39 0.37 0.38 0.38<br />
EE 0.30 0.30 0.27 0.32 0.33 0.30 0.31 0.33 0.34<br />
FSU 0.30 0.30 0.33 0.31 0.33 0.32 0.29 0.30 0.29<br />
ME 0.22 0.30 0.25 0.29 0.38 0.28 0.34 0.40 0.38<br />
SAs 0.27 0.26 0.28 0.27 0.27 0.28 0.26 0.33 0.32<br />
EAs 0.26 0.26 0.28 0.27 0.30 0.29 0.30 0.35 0.34<br />
SEAs 0.28 0.30 0.28 0.26 0.31 0.30 0.33 0.34 0.36<br />
Oc 0.26 0.33 0.35 0.29 0.33 0.38 0.37 0.36 0.37<br />
Jap 0.30 0.40 0.42 0.39 0.40 0.44 0.44 0.42 0.46<br />
Source: IEA, 1998<br />
For the adjustment time in fuel substitution we use 6-8 years; for the substitution dynamics<br />
between thermal (T) and non-thermal (NT) capacity we use 20 years. Choices for the important<br />
parameters are shown in 7DEOH and 7DEOH.


