

Targets IMage Energy Regional (TIMER) Model, Technical ...
Targets IMage Energy Regional (TIMER) Model, Technical ...
Targets IMage Energy Regional (TIMER) Model, Technical ...

Create successful ePaper yourself
Turn your PDF publications into a flip-book with our unique Google optimized e-Paper software.
RIVM report 461502024 page 27 of 188<br />
general, the differences can be given a sensible interpretation and can be linked to similar<br />
analyses done by others (E.g. Sorensen, 1998).<br />
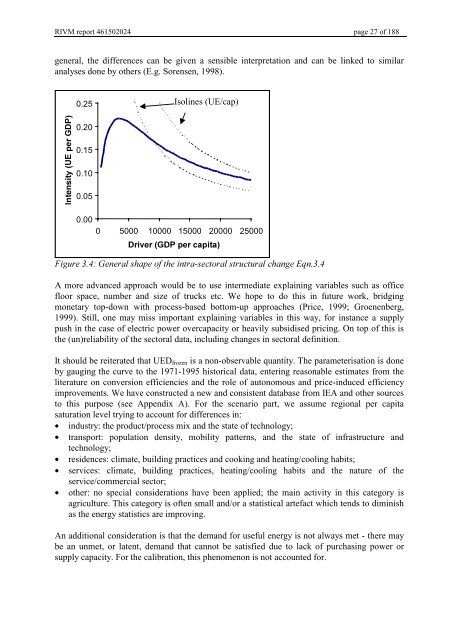
0.25<br />
Isolines (UE/cap)<br />
,QWHQVLW\8(SHU*'3<br />
0.20<br />
0.15<br />
0.10<br />
0.05<br />
0.00<br />
0 5000 10000 15000 20000 25000<br />
'ULYHU*'3SHUFDSLWD<br />
)LJXUH*HQHUDOVKDSHRIWKHLQWUDVHFWRUDOVWUXFWXUDOFKDQJH(TQ<br />
A more advanced approach would be to use intermediate explaining variables such as office<br />
floor space, number and size of trucks etc. We hope to do this in future work, bridging<br />
monetary top-down with process-based bottom-up approaches (Price, 1999; Groenenberg,<br />
1999). Still, one may miss important explaining variables in this way, for instance a supply<br />
push in the case of electric power overcapacity or heavily subsidised pricing. On top of this is<br />
the (un)reliability of the sectoral data, including changes in sectoral definition.<br />
It should be reiterated that UED frozen is a non-observable quantity. The parameterisation is done<br />
by gauging the curve to the 1971-1995 historical data, entering reasonable estimates from the<br />
literature on conversion efficiencies and the role of autonomous and price-induced efficiency<br />
improvements. We have constructed a new and consistent database from IEA and other sources<br />
to this purpose (see Appendix A). For the scenario part, we assume regional per capita<br />
saturation level trying to account for differences in:<br />
• industry: the product/process mix and the state of technology;<br />
• transport: population density, mobility patterns, and the state of infrastructure and<br />
technology;<br />
• residences: climate, building practices and cooking and heating/cooling habits;<br />
• services: climate, building practices, heating/cooling habits and the nature of the<br />
service/commercial sector;<br />
• other: no special considerations have been applied; the main activity in this category is<br />
agriculture. This category is often small and/or a statistical artefact which tends to diminish<br />
as the energy statistics are improving.<br />
An additional consideration is that the demand for useful energy is not always met - there may<br />
be an unmet, or latent, demand that cannot be satisfied due to lack of purchasing power or<br />
supply capacity. For the calibration, this phenomenon is not accounted for.


