

Targets IMage Energy Regional (TIMER) Model, Technical ...
Targets IMage Energy Regional (TIMER) Model, Technical ...
Targets IMage Energy Regional (TIMER) Model, Technical ...

Create successful ePaper yourself
Turn your PDF publications into a flip-book with our unique Google optimized e-Paper software.
RIVM report 461502024 page 99 of 188<br />
Rogner’s estimate of world ultimately recoverable conventional oil resources is about 18.000<br />
EJ, which is at the higher end of the range mentioned above. Rogner’s estimate of<br />
unconventional oil occurrences is an astounding 92.000 EJ.<br />
The question is which oil resources can be mobilised depending on the extraction costs. )LJXUH<br />
shows some of different supply cost curves for conventional and unconventional oil found<br />
in literature. These curvescan be interpretedas the rate at which oil production costs may be<br />
expected to increase in a world without fuel trade barriers.<br />
7DEOH*OREDORLOUHVRXUFHVDFFRUGLQJWR5RJQHU<br />
7\SHRIRLO 2FFXUUHQFH EJ<br />
Conventional Oil Cum. Prod (1971-1995) 3057<br />
Proved reserves 6289<br />
Estimated Additional 2542<br />
Add. Special 3534<br />
Enhanced recovery 5774<br />
Shale, Bitumen and Heavy<br />
Oils<br />
Reserves 1893<br />
Resources 14052<br />
Add. Occurences I 24582<br />
Add. Occurences II 51768<br />
25000<br />
EJ<br />
20000<br />
15000<br />
10000<br />
5000<br />
0<br />
1 CAN<br />
2 USA<br />
3 CAM<br />
4 SAM<br />
5 N AFR<br />
6 W AFR<br />
7 E AFR<br />
8 S AFR<br />
9 OECD Eur<br />
10 East Eur<br />
Region<br />
11 CIS<br />
12 MidEast<br />
13 India+<br />
14 China+<br />
15 SEA<br />
16 Oceania<br />
17 Japan<br />
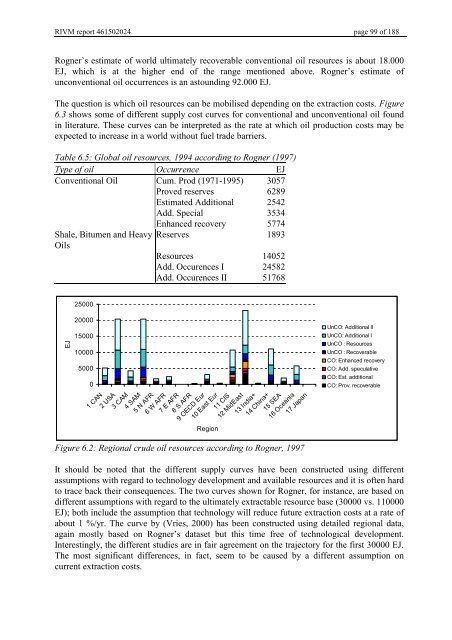
)LJXUH5HJLRQDOFUXGHRLOUHVRXUFHVDFFRUGLQJWR5RJQHU<br />
UnCO: Additional II<br />
UnCO: Additional I<br />
UnCO : Resources<br />
UnCO : Recoverable<br />
CO: Enhanced recovery<br />
CO: Add. speculative<br />
CO: Est. additional<br />
CO: Prov. recoverable<br />
It should be noted that the different supply curves have been constructed using different<br />
assumptions with regard to technology development and available resources and it is often hard<br />
to trace back their consequences. The two curves shown for Rogner, for instance, are based on<br />
different assumptions with regard to the ultimately extractable resource base (30000 vs. 110000<br />
EJ); both include the assumption that technology will reduce future extraction costs at a rate of<br />
about 1 %/yr. The curve by (Vries, 2000) has been constructed using detailed regional data,<br />
again mostly based on Rogner’s dataset but this time free of technological development.<br />
Interestingly, the different studies are in fair agreement on the trajectory for the first 30000 EJ.<br />
The most significant differences, in fact, seem to be caused by a different assumption on<br />
current extraction costs.


