Targets IMage Energy Regional (TIMER) Model, Technical ...
Targets IMage Energy Regional (TIMER) Model, Technical ...
Targets IMage Energy Regional (TIMER) Model, Technical ...
Create successful ePaper yourself
Turn your PDF publications into a flip-book with our unique Google optimized e-Paper software.
RIVM report 461502024 page 137 of 188<br />
For N 2 O from stationary sources, emission factors were set equal for all regions and kept<br />
constant over time, except for the emission factors for national transport sources (energy<br />
carrier: LLF, i.e. gasoline). For non-OECD regions the same value was used for the period<br />
1970-1995, except for the regions Canada, USA and Japan, which were assigned to a higher<br />
factor over the period 1970-1995 because of the increasing fraction of catalyst-equipped cars in<br />
the vehicle fleet, and Oceania and OECD Europe having introduced catalytic converters in the<br />
late 80’s. Emission factor values are calibrated to the shares of catalyst equipped gasoline cars<br />
in these regions in 1990 as determined for EDGAR 2.0 (Table 1 in Olivier HW DO 1999). In<br />
IMAGE 2.1 these region- and year-specific emission factors for (road) transport were only<br />
included for the Canada and USA.<br />
For CO, NO x and NMVOC, the region-, energy carrier- and sector-specific emission factors for<br />
1990 were based on the aggregated factors from EDGAR 2.0. Subsequently, it was assumed<br />
that emission factors which are in 1990 lower than the 1990 global average factor for that<br />
sector and fuel type, were higher in the past due to active or gradual improvements in<br />
technology or increased application of control technology. Thus, in these cases the emission<br />
factors for 1970 were put at the average value of 1990 with interpolated values in between. For<br />
emission factors in 1990 that were higher than the global average the values are assumed to be<br />
constant in the period 1970-1990. The transportation sector is the dominant sector for the CO<br />
and NMVOC emissions from fossil fuel use and is also a major contributor to NO x emissions.<br />
SO 2 emissions which are the largest source of sulphate aerosols and, thus important in<br />
assessing climate change, are primarily caused by the energy-related sulphur emissions. Sectorand<br />
region-specific emission factors for 1990 were taken from EDGAR 2.0 (Olivier HW DO,<br />
1996; 1999), for fuel combustion provided by Berdowski (pers. comm., 1995), Kato and<br />
Akimoto (1992).<br />
For the calculation of the energy SO 2 emissions an updated methodology is used by combining<br />
regional fuel consumption figures with data on fuel properties, in particular the sulphur content<br />
of coal and oil (6X&), ash retention characteristics of each fuel and combustion process, and the<br />
level of emissions controls in each sector. For each region the following equation is summed<br />
over fuel types and consumption:<br />
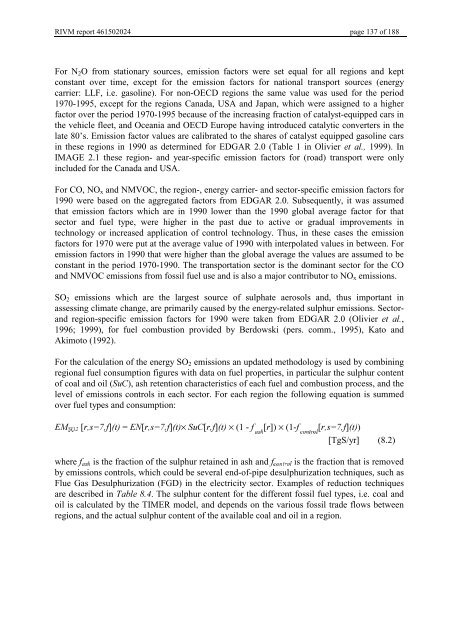
(0 62 [UV I]W = (1[UV I]W× 6X&[UI]W× (1 - I DVK<br />
[U]) × (1-I FRQWURO<br />
[UV I]W)<br />
[TgS/yr] (8.2)<br />
where I DVK is the fraction of the sulphur retained in ash and I FRQWURO is the fraction that is removed<br />
by emissions controls, which could be several end-of-pipe desulphurization techniques, such as<br />
Flue Gas Desulphurization (FGD) in the electricity sector. Examples of reduction techniques<br />
are described in 7DEOH. The sulphur content for the different fossil fuel types, i.e. coal and<br />
oil is calculated by the <strong>TIMER</strong> model, and depends on the various fossil trade flows between<br />
regions, and the actual sulphur content of the available coal and oil in a region.


