

Targets IMage Energy Regional (TIMER) Model, Technical ...
Targets IMage Energy Regional (TIMER) Model, Technical ...
Targets IMage Energy Regional (TIMER) Model, Technical ...

You also want an ePaper? Increase the reach of your titles
YUMPU automatically turns print PDFs into web optimized ePapers that Google loves.
RIVM report 461502024 page 63 of 188<br />
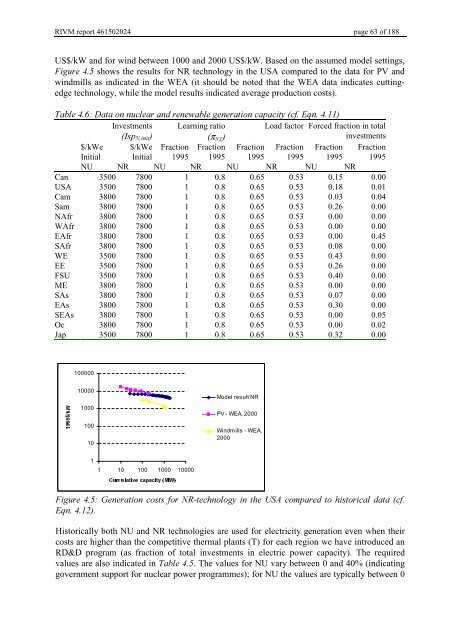
US$/kW and for wind between 1000 and 2000 US$/kW. Based on the assumed model settings,<br />
)LJXUH shows the results for NR technology in the USA compared to the data for PV and<br />
windmills as indicated in the WEA (it should be noted that the WEA data indicates cuttingedge<br />
technology, while the model results indicated average production costs).<br />
7DEOH'DWDRQQXFOHDUDQGUHQHZDEOHJHQHUDWLRQFDSDFLW\FI(TQ<br />
Investments<br />
,VS 1LQLW <br />
Learning ratio<br />
(π 17 <br />
Load factor Forced fraction in total<br />
investments<br />
$/kWe $/kWe Fraction Fraction Fraction Fraction Fraction Fraction<br />
Initial Initial 1995 1995 1995 1995 1995 1995<br />
NU NR NU NR NU NR NU NR<br />
Can 3500 7800 1 0.8 0.65 0.53 0.15 0.00<br />
USA 3500 7800 1 0.8 0.65 0.53 0.18 0.01<br />
Cam 3800 7800 1 0.8 0.65 0.53 0.03 0.04<br />
Sam 3800 7800 1 0.8 0.65 0.53 0.26 0.00<br />
NAfr 3800 7800 1 0.8 0.65 0.53 0.00 0.00<br />
WAfr 3800 7800 1 0.8 0.65 0.53 0.00 0.00<br />
EAfr 3800 7800 1 0.8 0.65 0.53 0.00 0.45<br />
SAfr 3800 7800 1 0.8 0.65 0.53 0.08 0.00<br />
WE 3500 7800 1 0.8 0.65 0.53 0.43 0.00<br />
EE 3500 7800 1 0.8 0.65 0.53 0.26 0.00<br />
FSU 3500 7800 1 0.8 0.65 0.53 0.40 0.00<br />
ME 3800 7800 1 0.8 0.65 0.53 0.00 0.00<br />
SAs 3800 7800 1 0.8 0.65 0.53 0.07 0.00<br />
EAs 3800 7800 1 0.8 0.65 0.53 0.30 0.00<br />
SEAs 3800 7800 1 0.8 0.65 0.53 0.00 0.05<br />
Oc 3800 7800 1 0.8 0.65 0.53 0.00 0.02<br />
Jap 3500 7800 1 0.8 0.65 0.53 0.32 0.00<br />
100000<br />
:<br />
N<br />
Ç<br />
<br />
<br />
<br />
10000<br />
1000<br />
100<br />
10<br />
<strong>Model</strong> result NR<br />
PV - WEA, 2000<br />
Windmills - WEA,<br />
2000<br />
1<br />
1 10 100 1000 10000<br />
&XPXODWLYHÃFDSDFLW\Ã0:<br />
)LJXUH*HQHUDWLRQFRVWVIRU15WHFKQRORJ\LQWKH86$FRPSDUHGWRKLVWRULFDOGDWDFI<br />
(TQ<br />
Historically both NU and NR technologies are used for electricity generation even when their<br />
costs are higher than the competitive thermal plants (T) for each region we have introduced an<br />
RD&D program (as fraction of total investments in electric power capacity). The required<br />
values are also indicated in 7DEOH. The values for NU vary between 0 and 40% (indicating<br />
government support for nuclear power programmes); for NU the values are typically between 0


