

Targets IMage Energy Regional (TIMER) Model, Technical ...
Targets IMage Energy Regional (TIMER) Model, Technical ...
Targets IMage Energy Regional (TIMER) Model, Technical ...

You also want an ePaper? Increase the reach of your titles
YUMPU automatically turns print PDFs into web optimized ePapers that Google loves.
page 62 of 188 RIVM report 461502024<br />
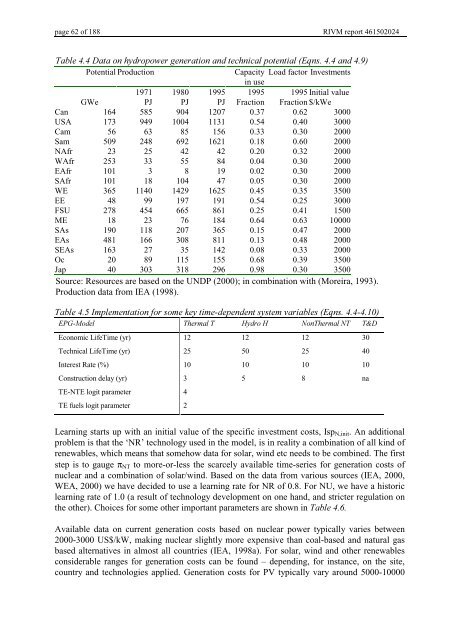
7DEOH'DWDRQK\GURSRZHUJHQHUDWLRQDQGWHFKQLFDOSRWHQWLDO(TQVDQG<br />
Potential Production<br />
Capacity Load factor Investments<br />
in use<br />
1971 1980 1995 1995 1995 Initial value<br />
GWe PJ PJ PJ Fraction Fraction $/kWe<br />
Can 164 585 904 1207 0.37 0.62 3000<br />
USA 173 949 1004 1131 0.54 0.40 3000<br />
Cam 56 63 85 156 0.33 0.30 2000<br />
Sam 509 248 692 1621 0.18 0.60 2000<br />
NAfr 23 25 42 42 0.20 0.32 2000<br />
WAfr 253 33 55 84 0.04 0.30 2000<br />
EAfr 101 3 8 19 0.02 0.30 2000<br />
SAfr 101 18 104 47 0.05 0.30 2000<br />
WE 365 1140 1429 1625 0.45 0.35 3500<br />
EE 48 99 197 191 0.54 0.25 3000<br />
FSU 278 454 665 861 0.25 0.41 1500<br />
ME 18 23 76 184 0.64 0.63 10000<br />
SAs 190 118 207 365 0.15 0.47 2000<br />
EAs 481 166 308 811 0.13 0.48 2000<br />
SEAs 163 27 35 142 0.08 0.33 2000<br />
Oc 20 89 115 155 0.68 0.39 3500<br />
Jap 40 303 318 296 0.98 0.30 3500<br />
Source: Resources are based on the UNDP (2000); in combination with (Moreira, 1993).<br />
Production data from IEA (1998).<br />
7DEOH,PSOHPHQWDWLRQIRUVRPHNH\WLPHGHSHQGHQWV\VWHPYDULDEOHV(TQV<br />
(3*0RGHO 7KHUPDO7 +\GUR+ 1RQ7KHUPDO17 7 '<br />
Economic LifeTime (yr) 12 12 12 30<br />
<strong>Technical</strong> LifeTime (yr) 25 50 25 40<br />
Interest Rate (%) 10 10 10 10<br />
Construction delay (yr) 3 5 8 na<br />
TE-NTE logit parameter 4<br />
TE fuels logit parameter 2<br />
Learning starts up with an initial value of the specific investment costs, Isp N,init . An additional<br />
problem is that the ‘NR’ technology used in the model, is in reality a combination of all kind of<br />
renewables, which means that somehow data for solar, wind etc needs to be combined. The first<br />
step is to gauge π NT to more-or-less the scarcely available time-series for generation costs of<br />
nuclear and a combination of solar/wind. Based on the data from various sources (IEA, 2000,<br />
WEA, 2000) we have decided to use a learning rate for NR of 0.8. For NU, we have a historic<br />
learning rate of 1.0 (a result of technology development on one hand, and stricter regulation on<br />
the other). Choices for some other important parameters are shown in 7DEOH<br />
Available data on current generation costs based on nuclear power typically varies between<br />
2000-3000 US$/kW, making nuclear slightly more expensive than coal-based and natural gas<br />
based alternatives in almost all countries (IEA, 1998a). For solar, wind and other renewables<br />
considerable ranges for generation costs can be found – depending, for instance, on the site,<br />
country and technologies applied. Generation costs for PV typically vary around 5000-10000


