

Targets IMage Energy Regional (TIMER) Model, Technical ...
Targets IMage Energy Regional (TIMER) Model, Technical ...
Targets IMage Energy Regional (TIMER) Model, Technical ...

Create successful ePaper yourself
Turn your PDF publications into a flip-book with our unique Google optimized e-Paper software.
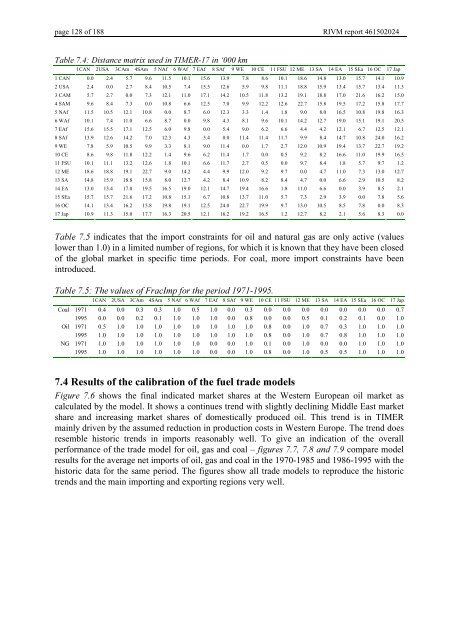
page 128 of 188 RIVM report 461502024<br />
7DEOH'LVWDQFHPDWUL[XVHGLQ7,0(5LQµNP<br />
1CAN 2USA 3CAm 4SAm 5 NAf 6 WAf 7 EAf 8 SAf 9 WE 10 CE 11 FSU 12 ME 13 SA 14 EA 15 SEa 16 OC 17 Jap<br />
1 CAN 0.0 2.4 5.7 9.6 11.5 10.1 15.6 13.9 7.8 8.6 10.1 18.6 14.8 13.0 15.7 14.1 10.9<br />
2 USA 2.4 0.0 2.7 8.4 10.5 7.4 15.5 12.6 5.9 9.8 11.1 18.8 15.9 13.4 15.7 13.4 11.3<br />
3 CAM 5.7 2.7 0.0 7.3 12.1 11.0 17.1 14.2 10.5 11.8 13.2 19.1 18.8 17.0 21.6 16.2 15.0<br />
4 SAM 9.6 8.4 7.3 0.0 10.8 6.6 12.5 7.0 9.9 12.2 12.6 22.7 15.8 19.5 17.2 15.8 17.7<br />
5 NAf 11.5 10.5 12.1 10.8 0.0 8.7 6.0 12.3 3.3 1.4 1.8 9.0 8.0 16.5 10.8 19.8 16.3<br />
6 WAf 10.1 7.4 11.0 6.6 8.7 0.0 9.8 4.3 8.1 9.6 10.1 14.2 12.7 19.0 15.1 19.1 20.5<br />
7 EAf 15.6 15.5 17.1 12.5 6.0 9.8 0.0 5.4 9.0 6.2 6.6 4.4 4.2 12.1 6.7 12.5 12.1<br />
8 SAf 13.9 12.6 14.2 7.0 12.3 4.3 5.4 0.0 11.4 11.4 11.7 9.9 8.4 14.7 10.8 24.0 16.2<br />
9 WE 7.8 5.9 10.5 9.9 3.3 8.1 9.0 11.4 0.0 1.7 2.7 12.0 10.9 19.4 13.7 22.7 19.2<br />
10 CE 8.6 9.8 11.8 12.2 1.4 9.6 6.2 11.4 1.7 0.0 0.5 9.2 8.2 16.6 11.0 19.9 16.5<br />
11 FSU 10.1 11.1 13.2 12.6 1.8 10.1 6.6 11.7 2.7 0.5 0.0 9.7 8.4 1.8 5.7 9.7 1.2<br />
12 ME 18.6 18.8 19.1 22.7 9.0 14.2 4.4 9.9 12.0 9.2 9.7 0.0 4.7 11.0 7.3 13.0 12.7<br />
13 SA 14.8 15.9 18.8 15.8 8.0 12.7 4.2 8.4 10.9 8.2 8.4 4.7 0.0 6.6 2.9 10.5 8.2<br />
14 EA 13.0 13.4 17.0 19.5 16.5 19.0 12.1 14.7 19.4 16.6 1.8 11.0 6.6 0.0 3.9 8.5 2.1<br />
15 SEa 15.7 15.7 21.6 17.2 10.8 15.1 6.7 10.8 13.7 11.0 5.7 7.3 2.9 3.9 0.0 7.8 5.6<br />
16 OC 14.1 13.4 16.2 15.8 19.8 19.1 12.5 24.0 22.7 19.9 9.7 13.0 10.5 8.5 7.8 0.0 8.3<br />
17 Jap 10.9 11.3 15.0 17.7 16.3 20.5 12.1 16.2 19.2 16.5 1.2 12.7 8.2 2.1 5.6 8.3 0.0<br />
7DEOH indicates that the import constraints for oil and natural gas are only active (values<br />
lower than 1.0) in a limited number of regions, for which it is known that they have been closed<br />
of the global market in specific time periods. For coal, more import constraints have been<br />
introduced.<br />
7DEOH7KHYDOXHVRI)UDF,PSIRUWKHSHULRG<br />
1CAN 2USA 3CAm 4SAm 5 NAf 6 WAf 7 EAf 8 SAf 9 WE 10 CE 11 FSU 12 ME 13 SA 14 EA 15 SEa 16 OC 17 Jap<br />
Coal 1971 0.4 0.0 0.3 0.3 1.0 0.5 1.0 0.0 0.3 0.0 0.0 0.0 0.0 0.0 0.0 0.0 0.7<br />
1995 0.0 0.0 0.2 0.1 1.0 1.0 1.0 0.0 0.8 0.0 0.0 0.5 0.1 0.2 0.1 0.0 1.0<br />
Oil 1971 0.5 1.0 1.0 1.0 1.0 1.0 1.0 1.0 1.0 0.8 0.0 1.0 0.7 0.3 1.0 1.0 1.0<br />
1995 1.0 1.0 1.0 1.0 1.0 1.0 1.0 1.0 1.0 0.8 0.0 1.0 0.7 0.8 1.0 1.0 1.0<br />
NG 1971 1.0 1.0 1.0 1.0 1.0 1.0 0.0 0.0 1.0 0.1 0.0 1.0 0.0 0.0 1.0 1.0 1.0<br />
1995 1.0 1.0 1.0 1.0 1.0 1.0 0.0 0.0 1.0 0.8 0.0 1.0 0.5 0.5 1.0 1.0 1.0<br />
5HVXOWVRIWKHFDOLEUDWLRQRIWKHIXHOWUDGHPRGHOV<br />
)LJXUH shows the final indicated market shares at the Western European oil market as<br />
calculated by the model. It shows a continues trend with slightly declining Middle East market<br />
share and increasing market shares of domestically produced oil. This trend is in <strong>TIMER</strong><br />
mainly driven by the assumed reduction in production costs in Western Europe. The trend does<br />
resemble historic trends in imports reasonably well. To give an indication of the overall<br />
performance of the trade model for oil, gas and coal – ILJXUHVDQGcompare model<br />
results for the average net imports of oil, gas and coal in the 1970-1985 and 1986-1995 with the<br />
historic data for the same period. The figures show all trade models to reproduce the historic<br />
trends and the main importing and exporting regions very well.


