

Targets IMage Energy Regional (TIMER) Model, Technical ...
Targets IMage Energy Regional (TIMER) Model, Technical ...
Targets IMage Energy Regional (TIMER) Model, Technical ...

Create successful ePaper yourself
Turn your PDF publications into a flip-book with our unique Google optimized e-Paper software.
RIVM report 461502024 page 61 of 188<br />
0.35<br />
0.30<br />
0.25<br />
7'/)<br />
0.20<br />
0.15<br />
0.10<br />
0.05<br />
0.00<br />
1971<br />
1980<br />
1995<br />
Can<br />
USA<br />
Cam<br />
Sam<br />
NAfr<br />
WAfr<br />
EAfr<br />
SAfr<br />
WE<br />
EE<br />
FSU<br />
ME<br />
SAs<br />
EAs<br />
SEAs<br />
Oc<br />
Jap<br />
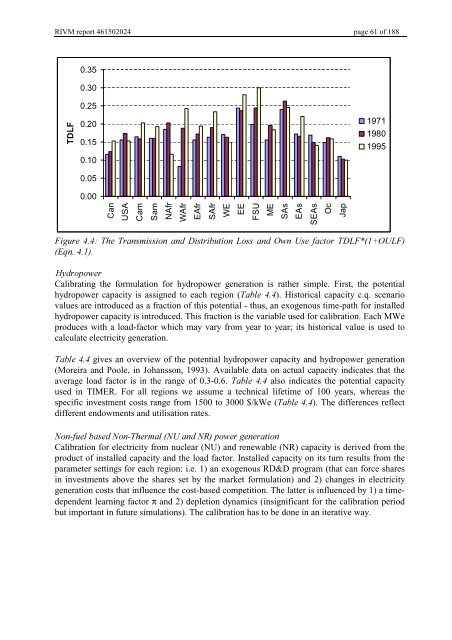
)LJXUH 7KH 7UDQVPLVVLRQ DQG 'LVWULEXWLRQ /RVV DQG 2ZQ 8VH IDFWRU 7'/)28/)<br />
(TQ<br />
+\GURSRZHU<br />
Calibrating the formulation for hydropower generation is rather simple. First, the potential<br />
hydropower capacity is assigned to each region (7DEOH ). Historical capacity c.q. scenario<br />
values are introduced as a fraction of this potential - thus, an exogenous time-path for installed<br />
hydropower capacity is introduced. This fraction is the variable used for calibration. Each MWe<br />
produces with a load-factor which may vary from year to year; its historical value is used to<br />
calculate electricity generation.<br />
7DEOH gives an overview of the potential hydropower capacity and hydropower generation<br />
(Moreira and Poole, in Johansson, 1993). Available data on actual capacity indicates that the<br />
average load factor is in the range of 0.3-0.6. 7DEOH also indicates the potential capacity<br />
used in <strong>TIMER</strong>. For all regions we assume a technical lifetime of 100 years, whereas the<br />
specific investment costs range from 1500 to 3000 $/kWe (7DEOH). The differences reflect<br />
different endowments and utilisation rates.<br />
1RQIXHOEDVHG1RQ7KHUPDO18DQG15SRZHUJHQHUDWLRQ<br />
Calibration for electricity from nuclear (NU) and renewable (NR) capacity is derived from the<br />
product of installed capacity and the load factor. Installed capacity on its turn results from the<br />
parameter settings for each region: i.e. 1) an exogenous RD&D program (that can force shares<br />
in investments above the shares set by the market formulation) and 2) changes in electricity<br />
generation costs that influence the cost-based competition. The latter is influenced by 1) a timedependent<br />
learning factor π and 2) depletion dynamics (insignificant for the calibration period<br />
but important in future simulations). The calibration has to be done in an iterative way.


