

Keith Vodden Dr. Douglas Smith - Transports Canada
Keith Vodden Dr. Douglas Smith - Transports Canada
Keith Vodden Dr. Douglas Smith - Transports Canada

Create successful ePaper yourself
Turn your PDF publications into a flip-book with our unique Google optimized e-Paper software.
Analysis and Estimation of the Social Cost of Motor Vehicle Collisions in Ontario<br />
yields 5,293 unique persons who were injured in motor vehicle collisions, admitted to<br />
hospital and survived. This definition is most in keeping with the major injury category of<br />
ORSAR.<br />
The number of emergency room visits not requiring a hospital stay is also<br />
estimated using MOH<C data. From the total number of visits to an Emergency<br />
Room (ER) we select only those going to ER for an unplanned visit for a new clinical<br />
condition. From this number we subtract those who:<br />
• Leave without being seen, treated, or having completed treatment (included in<br />
minimal injuries).<br />
• Are admitted (major injury).<br />
• Die on or after arrival (fatalities).<br />
• Transfer to another care facility (possible duplicate in data).<br />
According to the MOT<C data a total of 60,726 individuals visit an<br />
emergency room and are released after care (comparable to minor injuries) as a result of<br />
motor vehicle collisions in 2004.<br />
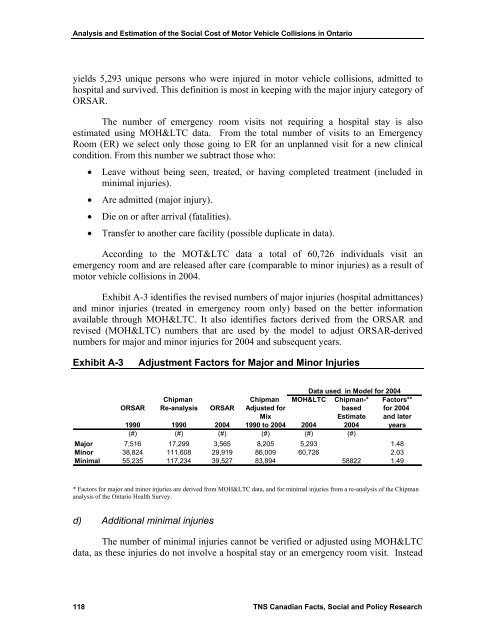
Exhibit A-3 identifies the revised numbers of major injuries (hospital admittances)<br />
and minor injuries (treated in emergency room only) based on the better information<br />
available through MOH<C. It also identifies factors derived from the ORSAR and<br />
revised (MOH<C) numbers that are used by the model to adjust ORSAR-derived<br />
numbers for major and minor injuries for 2004 and subsequent years.<br />
Exhibit A-3<br />
Adjustment Factors for Major and Minor Injuries<br />
Data used in Model for 2004<br />
Chipman Chipman MOH<C Chipman-* Factors**<br />
ORSAR Re-analysis ORSAR Adjusted for based for 2004<br />
Mix Estimate and later<br />
1990 1990 2004 1990 to 2004 2004 2004 years<br />
(#) (#) (#) (#) (#) (#)<br />
Major 7,516 17,299 3,565 8,205 5,293 1.48<br />
Minor 38,824 111,608 29,919 86,009 60,726 2.03<br />
Minimal 55,235 117,234 39,527 83,894 58822 1.49<br />
* Factors for major and minor injuries are derived from MOH<C data, and for minimal injuries from a re-analysis of the Chipman<br />
analysis of the Ontario Health Survey.<br />
d) Additional minimal injuries<br />
The number of minimal injuries cannot be verified or adjusted using MOH<C<br />
data, as these injuries do not involve a hospital stay or an emergency room visit. Instead<br />
118 TNS Canadian Facts, Social and Policy Research


