

Keith Vodden Dr. Douglas Smith - Transports Canada
Keith Vodden Dr. Douglas Smith - Transports Canada
Keith Vodden Dr. Douglas Smith - Transports Canada

Create successful ePaper yourself
Turn your PDF publications into a flip-book with our unique Google optimized e-Paper software.
Analysis and Estimation of the Social Cost of Motor Vehicle Collisions in Ontario<br />
demand for safety as described in Viscusi and Aldy (2003). The lower bound for the<br />
Activity Day variable and the severe injury variable are calculated in the same way.<br />
The upper bound estimates are based on the models estimated by Gunderson and<br />
Hyatt (2001). Their central point is that earlier estimates of the value of a statistical life<br />
may under-estimate the true value of this variable. The potential bias occurs because<br />
other models fail to account for risk preferences that may vary with income and do not<br />
control for selection factors based on risk preferences. In the case of the selection issue,<br />
this means that workers with less risk aversion will accept (self-select into) higher risk<br />
jobs and because they are less risk averse will demand a smaller compensating wage<br />
differential for exposure to risk. The smaller compensating wage differential then underestimates<br />
the required compensation of “average” members of the population for<br />
exposure to risk, thereby under-estimating the costs associated with workplace and other<br />
risks including motor vehicle risks.<br />
The value of a statistical life estimated by Gunderson and Hyatt is $12.75 million,<br />
expressed in 1988 dollars. Converting this to 2004 dollars using the wage index<br />
described above gives the value of $19.7 million shown in Exhibit A-16. The Gunderson<br />
and Hyatt models do not compute the Activity Day and Severe Injury variables that we<br />
plan to use in our modeling. Their overall results indicate that their correction factors<br />
would cause the values to increase by a factor of 5. As a result, we use this factor to<br />
calculate the upper bounds for these variables in Exhibit A-17. The final column of<br />
Exhibit A-15 calculates the mean of the upper and lower bound estimates.<br />
2. Discounted Future Earnings (DFE) Estimates<br />
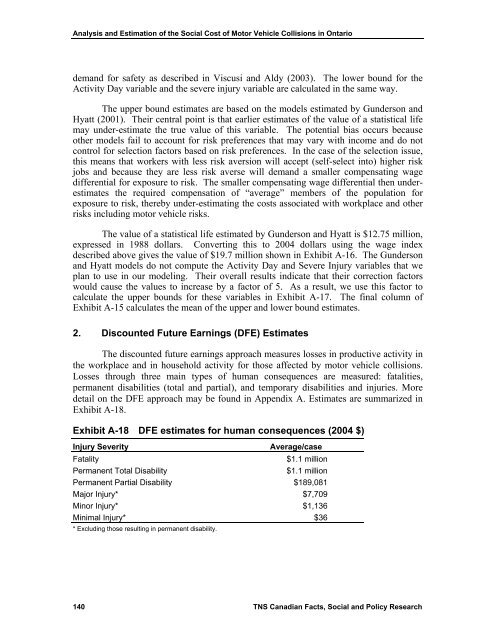
The discounted future earnings approach measures losses in productive activity in<br />
the workplace and in household activity for those affected by motor vehicle collisions.<br />
Losses through three main types of human consequences are measured: fatalities,<br />
permanent disabilities (total and partial), and temporary disabilities and injuries. More<br />
detail on the DFE approach may be found in Appendix A. Estimates are summarized in<br />
Exhibit A-18.<br />
Exhibit A-18 DFE estimates for human consequences (2004 $)<br />
Injury Severity<br />
Average/case<br />
Fatality<br />
$1.1 million<br />
Permanent Total Disability<br />
$1.1 million<br />
Permanent Partial Disability $189,081<br />
Major Injury* $7,709<br />
Minor Injury* $1,136<br />
Minimal Injury* $36<br />
* Excluding those resulting in permanent disability.<br />
140 TNS Canadian Facts, Social and Policy Research


