

Keith Vodden Dr. Douglas Smith - Transports Canada
Keith Vodden Dr. Douglas Smith - Transports Canada
Keith Vodden Dr. Douglas Smith - Transports Canada

Create successful ePaper yourself
Turn your PDF publications into a flip-book with our unique Google optimized e-Paper software.
Appendix A—Detail on Calculations of the Ontario Model<br />
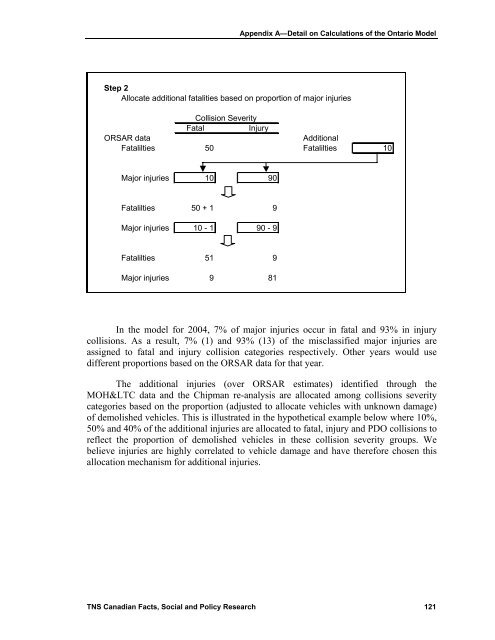
Step 2<br />
Allocate additional fatalities based on proportion of major injuries<br />
Collision Severity<br />
Fatal<br />
Injury<br />
ORSAR data<br />
Additional<br />
Fatalilties 50 Fatalilties 10<br />
Major injuries 10 90<br />
Fatalilties 50 + 1 9<br />
Major injuries 10 - 1 90 - 9<br />
Fatalilties 51 9<br />
Major injuries 9 81<br />
In the model for 2004, 7% of major injuries occur in fatal and 93% in injury<br />
collisions. As a result, 7% (1) and 93% (13) of the misclassified major injuries are<br />
assigned to fatal and injury collision categories respectively. Other years would use<br />
different proportions based on the ORSAR data for that year.<br />
The additional injuries (over ORSAR estimates) identified through the<br />
MOH<C data and the Chipman re-analysis are allocated among collisions severity<br />
categories based on the proportion (adjusted to allocate vehicles with unknown damage)<br />
of demolished vehicles. This is illustrated in the hypothetical example below where 10%,<br />
50% and 40% of the additional injuries are allocated to fatal, injury and PDO collisions to<br />
reflect the proportion of demolished vehicles in these collision severity groups. We<br />
believe injuries are highly correlated to vehicle damage and have therefore chosen this<br />
allocation mechanism for additional injuries.<br />
TNS Canadian Facts, Social and Policy Research 121


