

Keith Vodden Dr. Douglas Smith - Transports Canada
Keith Vodden Dr. Douglas Smith - Transports Canada
Keith Vodden Dr. Douglas Smith - Transports Canada

Create successful ePaper yourself
Turn your PDF publications into a flip-book with our unique Google optimized e-Paper software.
Appendix A—Detail on Calculations of the Ontario Model<br />
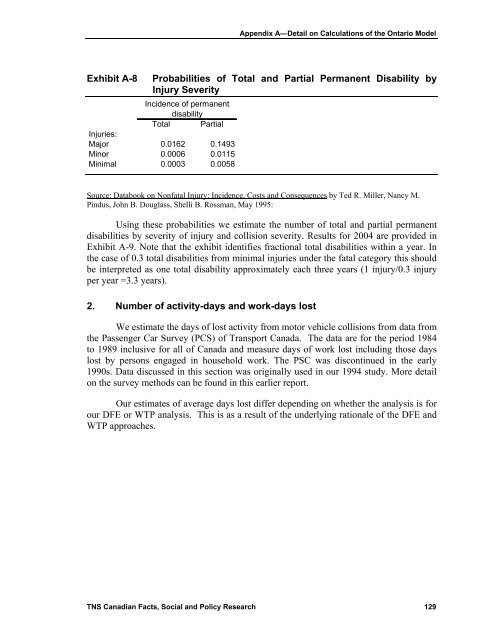
Exhibit A-8<br />
Probabilities of Total and Partial Permanent Disability by<br />
Injury Severity<br />
Incidence of permanent<br />
disability<br />
Total Partial<br />
Injuries:<br />
Major 0.0162 0.1493<br />
Minor 0.0006 0.0115<br />
Minimal 0.0003 0.0058<br />
Source: Databook on Nonfatal Injury: Incidence, Costs and Consequences by Ted R. Miller, Nancy M.<br />
Pindus, John B. <strong>Douglas</strong>s, Shelli B. Rossman, May 1995:<br />
Using these probabilities we estimate the number of total and partial permanent<br />
disabilities by severity of injury and collision severity. Results for 2004 are provided in<br />
Exhibit A-9. Note that the exhibit identifies fractional total disabilities within a year. In<br />
the case of 0.3 total disabilities from minimal injuries under the fatal category this should<br />
be interpreted as one total disability approximately each three years (1 injury/0.3 injury<br />
per year =3.3 years).<br />
2. Number of activity-days and work-days lost<br />
We estimate the days of lost activity from motor vehicle collisions from data from<br />
the Passenger Car Survey (PCS) of Transport <strong>Canada</strong>. The data are for the period 1984<br />
to 1989 inclusive for all of <strong>Canada</strong> and measure days of work lost including those days<br />
lost by persons engaged in household work. The PSC was discontinued in the early<br />
1990s. Data discussed in this section was originally used in our 1994 study. More detail<br />
on the survey methods can be found in this earlier report.<br />
Our estimates of average days lost differ depending on whether the analysis is for<br />
our DFE or WTP analysis. This is as a result of the underlying rationale of the DFE and<br />
WTP approaches.<br />
TNS Canadian Facts, Social and Policy Research 129


