

Keith Vodden Dr. Douglas Smith - Transports Canada
Keith Vodden Dr. Douglas Smith - Transports Canada
Keith Vodden Dr. Douglas Smith - Transports Canada

You also want an ePaper? Increase the reach of your titles
YUMPU automatically turns print PDFs into web optimized ePapers that Google loves.
Social Cost of Motor Vehicle Collisions in Ontario<br />
D. COMPARISON OF SOCIAL COSTS ESTIMATES FOR 2004 AND 1990<br />
Estimates of the social cost of motor vehicle collisions in Ontario for 2004 use a<br />
similar methodology to that employed by the estimates for 1990. We compare the results<br />
of the two studies in this section.<br />
The comparison we make uses the willingness to pay approach and low estimate<br />
scenario (this results in the same modelling approach to the value of human consequences<br />
in the two studies) and excludes cost items for court costs and traffic delays not estimated<br />
in the earlier study. This comparison allows us to focus on relative changes in the cost<br />
items between the two estimates.<br />
IV-4.<br />
The distribution of total costs by comparable cost component is noted in Exhibit<br />
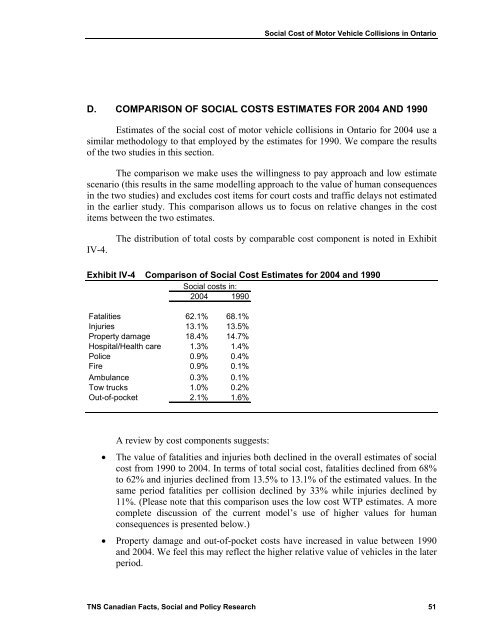
Exhibit IV-4 Comparison of Social Cost Estimates for 2004 and 1990<br />
Social costs in:<br />
2004 1990<br />
Fatalities 62.1% 68.1%<br />
Injuries 13.1% 13.5%<br />
Property damage 18.4% 14.7%<br />
Hospital/Health care 1.3% 1.4%<br />
Police 0.9% 0.4%<br />
Fire 0.9% 0.1%<br />
Ambulance 0.3% 0.1%<br />
Tow trucks 1.0% 0.2%<br />
Out-of-pocket 2.1% 1.6%<br />
A review by cost components suggests:<br />
• The value of fatalities and injuries both declined in the overall estimates of social<br />
cost from 1990 to 2004. In terms of total social cost, fatalities declined from 68%<br />
to 62% and injuries declined from 13.5% to 13.1% of the estimated values. In the<br />
same period fatalities per collision declined by 33% while injuries declined by<br />
11%. (Please note that this comparison uses the low cost WTP estimates. A more<br />
complete discussion of the current model’s use of higher values for human<br />
consequences is presented below.)<br />
• Property damage and out-of-pocket costs have increased in value between 1990<br />
and 2004. We feel this may reflect the higher relative value of vehicles in the later<br />
period.<br />
TNS Canadian Facts, Social and Policy Research 51


