

Keith Vodden Dr. Douglas Smith - Transports Canada
Keith Vodden Dr. Douglas Smith - Transports Canada
Keith Vodden Dr. Douglas Smith - Transports Canada

You also want an ePaper? Increase the reach of your titles
YUMPU automatically turns print PDFs into web optimized ePapers that Google loves.
Ontario Model<br />
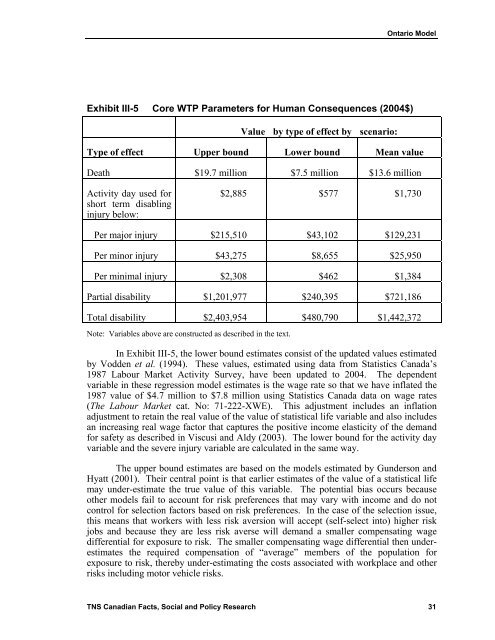
Exhibit III-5 Core WTP Parameters for Human Consequences (2004$)<br />
Value by type of effect by scenario:<br />
Type of effect Upper bound Lower bound Mean value<br />
Death $19.7 million $7.5 million $13.6 million<br />
Activity day used for<br />
short term disabling<br />
injury below:<br />
$2,885 $577 $1,730<br />
Per major injury $215,510 $43,102 $129,231<br />
Per minor injury $43,275 $8,655 $25,950<br />
Per minimal injury $2,308 $462 $1,384<br />
Partial disability $1,201,977 $240,395 $721,186<br />
Total disability $2,403,954 $480,790 $1,442,372<br />
Note: Variables above are constructed as described in the text.<br />
In Exhibit III-5, the lower bound estimates consist of the updated values estimated<br />
by <strong>Vodden</strong> et al. (1994). These values, estimated using data from Statistics <strong>Canada</strong>’s<br />
1987 Labour Market Activity Survey, have been updated to 2004. The dependent<br />
variable in these regression model estimates is the wage rate so that we have inflated the<br />
1987 value of $4.7 million to $7.8 million using Statistics <strong>Canada</strong> data on wage rates<br />
(The Labour Market cat. No: 71-222-XWE). This adjustment includes an inflation<br />
adjustment to retain the real value of the value of statistical life variable and also includes<br />
an increasing real wage factor that captures the positive income elasticity of the demand<br />
for safety as described in Viscusi and Aldy (2003). The lower bound for the activity day<br />
variable and the severe injury variable are calculated in the same way.<br />
The upper bound estimates are based on the models estimated by Gunderson and<br />
Hyatt (2001). Their central point is that earlier estimates of the value of a statistical life<br />
may under-estimate the true value of this variable. The potential bias occurs because<br />
other models fail to account for risk preferences that may vary with income and do not<br />
control for selection factors based on risk preferences. In the case of the selection issue,<br />
this means that workers with less risk aversion will accept (self-select into) higher risk<br />
jobs and because they are less risk averse will demand a smaller compensating wage<br />
differential for exposure to risk. The smaller compensating wage differential then underestimates<br />
the required compensation of “average” members of the population for<br />
exposure to risk, thereby under-estimating the costs associated with workplace and other<br />
risks including motor vehicle risks.<br />
TNS Canadian Facts, Social and Policy Research 31


