

Keith Vodden Dr. Douglas Smith - Transports Canada
Keith Vodden Dr. Douglas Smith - Transports Canada
Keith Vodden Dr. Douglas Smith - Transports Canada

Create successful ePaper yourself
Turn your PDF publications into a flip-book with our unique Google optimized e-Paper software.
Appendix A—Detail on Calculations of the Ontario Model<br />
Somewhat different estimates are provided in Transport <strong>Canada</strong>’s Urban<br />
Congestion in <strong>Canada</strong> (2006-Table 4). These numbers imply an upper bound of $20 per<br />
tonne of CO 2 and $102 per tonne of CO 2 for CAC emissions. Our calculations use an<br />
average of these numbers and the Resources for the Future estimate of $18 for a total of<br />
$70 per tonne of CO 2 and its associated CAC emissions.<br />
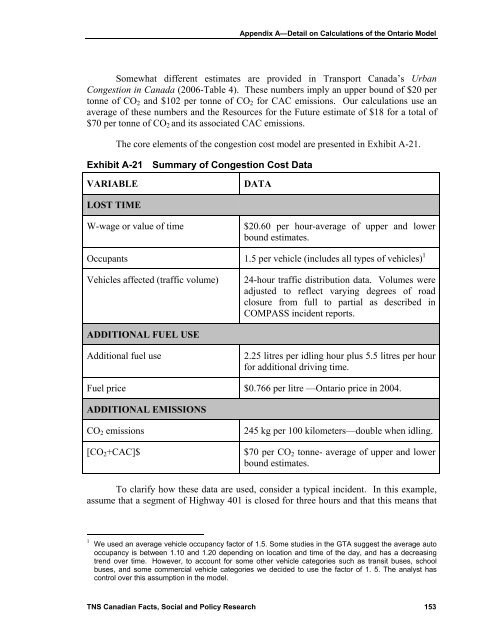
The core elements of the congestion cost model are presented in Exhibit A-21.<br />
Exhibit A-21 Summary of Congestion Cost Data<br />
VARIABLE<br />
DATA<br />
LOST TIME<br />
W-wage or value of time<br />
$20.60 per hour-average of upper and lower<br />
bound estimates.<br />
Occupants 1.5 per vehicle (includes all types of vehicles) 1<br />
Vehicles affected (traffic volume)<br />
24-hour traffic distribution data. Volumes were<br />
adjusted to reflect varying degrees of road<br />
closure from full to partial as described in<br />
COMPASS incident reports.<br />
ADDITIONAL FUEL USE<br />
Additional fuel use<br />
2.25 litres per idling hour plus 5.5 litres per hour<br />
for additional driving time.<br />
Fuel price $0.766 per litre —Ontario price in 2004.<br />
ADDITIONAL EMISSIONS<br />
CO 2 emissions<br />
[CO 2 +CAC]$<br />
245 kg per 100 kilometers—double when idling.<br />
$70 per CO 2 tonne- average of upper and lower<br />
bound estimates.<br />
To clarify how these data are used, consider a typical incident. In this example,<br />
assume that a segment of Highway 401 is closed for three hours and that this means that<br />
1 We used an average vehicle occupancy factor of 1.5. Some studies in the GTA suggest the average auto<br />
occupancy is between 1.10 and 1.20 depending on location and time of the day, and has a decreasing<br />
trend over time. However, to account for some other vehicle categories such as transit buses, school<br />
buses, and some commercial vehicle categories we decided to use the factor of 1. 5. The analyst has<br />
control over this assumption in the model.<br />
TNS Canadian Facts, Social and Policy Research 153


